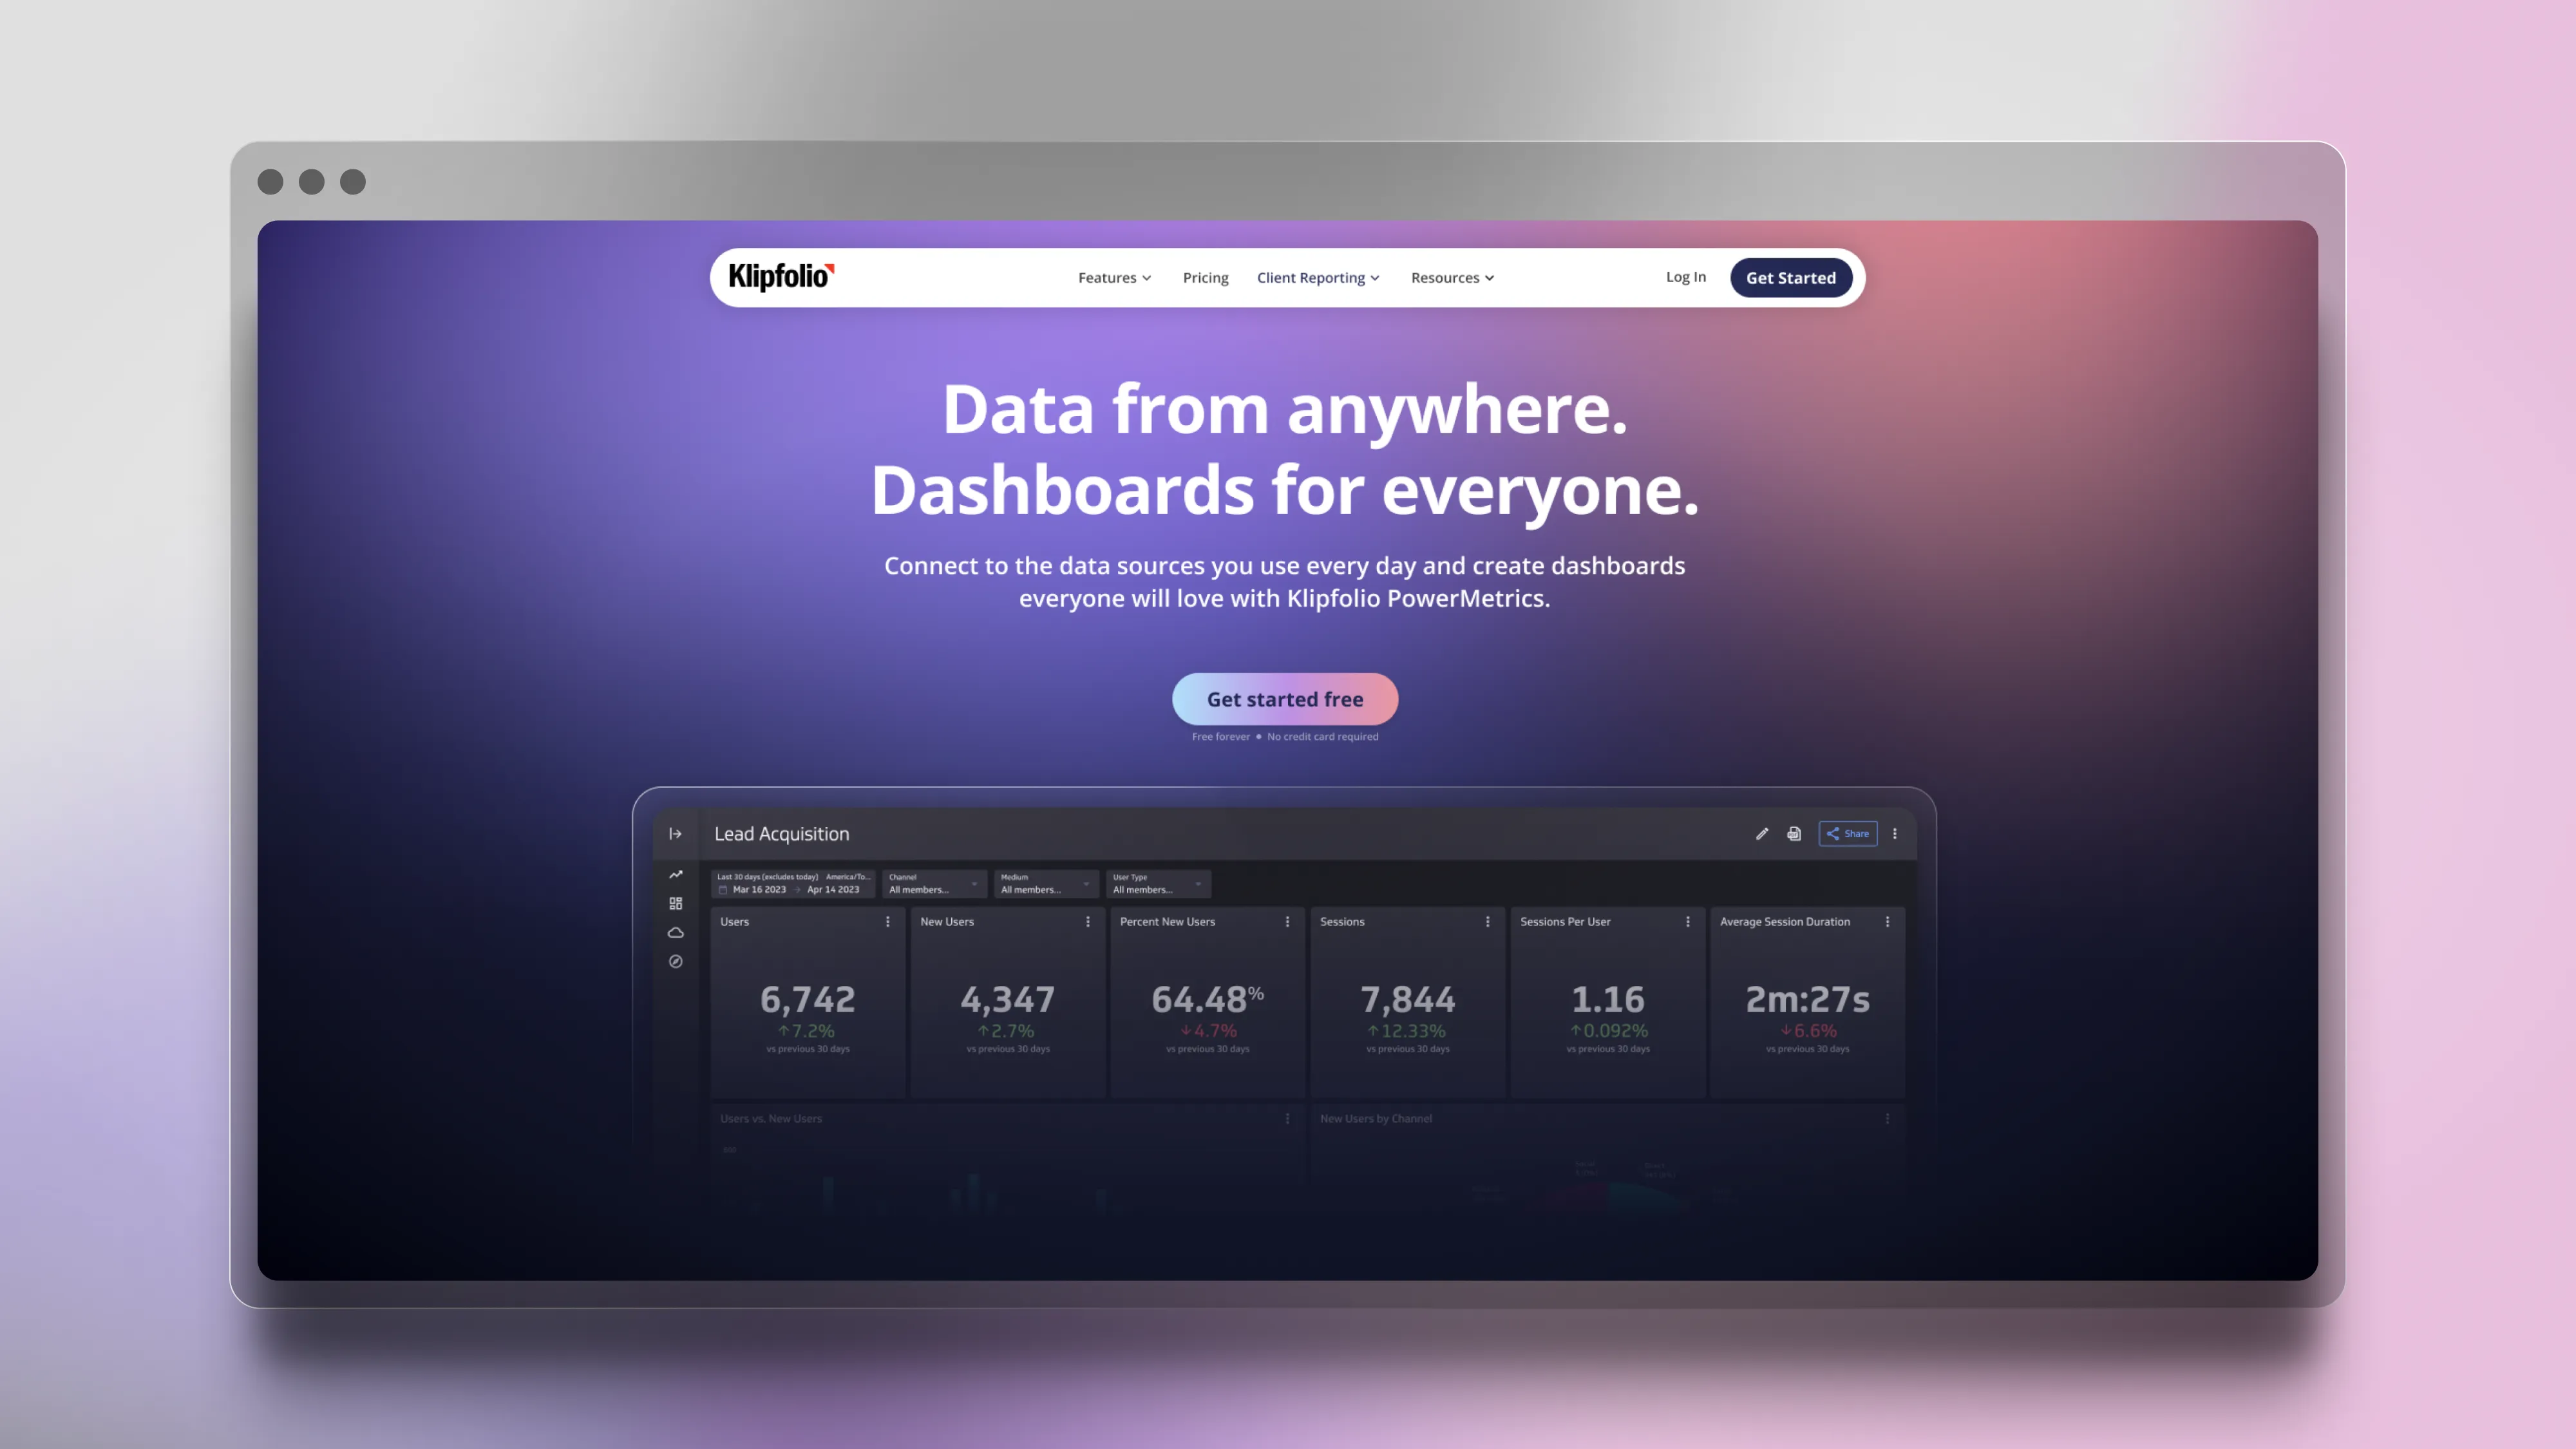
Metric Explorer
A powerful tool designed for advanced analysis, offering seamless AI integration to simplify complex tasks and enhance overall ease of use.
Want to learn more about this project? Reach out to me for a detailed presentation on how this project evolved, including insights into the design process, drafts, decision-making, and brainstorming stages.
Project Info
Metric Explorer
Project Lead
UX/UI Designer
Research
2024
The issue
Klipfolio PowerMetrics initially focused on providing an overview of metrics and dashboard creation. However, as we began serving more advanced users, it became clear that they needed a more flexible space to dive deeper into their data, uncover insights, and move beyond basic reporting. At the same time, it was crucial not to overwhelm less experienced users with complex features.
"
I need to dig deeper into my data to uncover insights and trends that aren’t visible in my weekly reports.
Customer - Technical User
"
Our business users are constantly asking questions that go beyond the reports and dashboards, so I end up going back to the raw data to pull out the answers.
Customer - Technical User
"
It’s frustrating having to rely on my data team for answers every time. Can you help streamline that process?
Customer - Technical User
"
I want to compare different metrics side by side. Seeing performance data against past results—and even future projections—based on trends would be really valuable.
Customer - Technical User
What our users are saying?
Through surveys and direct conversations with customers and partners, we’ve identified key needs.
- Desire for Self-Serve Analytics: Users want a simpler, more intuitive tool—not as complex as Tableau or Power BI—focused on ease of use and quick access to insights.
- Control and Flexibility: Users are asking for more control over their data exploration, with deeper capabilities like advanced analysis, multi-metric views, and richer visualization options.
- Assistance with Data: Users also seek assistance in understanding their data, with features like projections and comparisons to make insights more actionable.
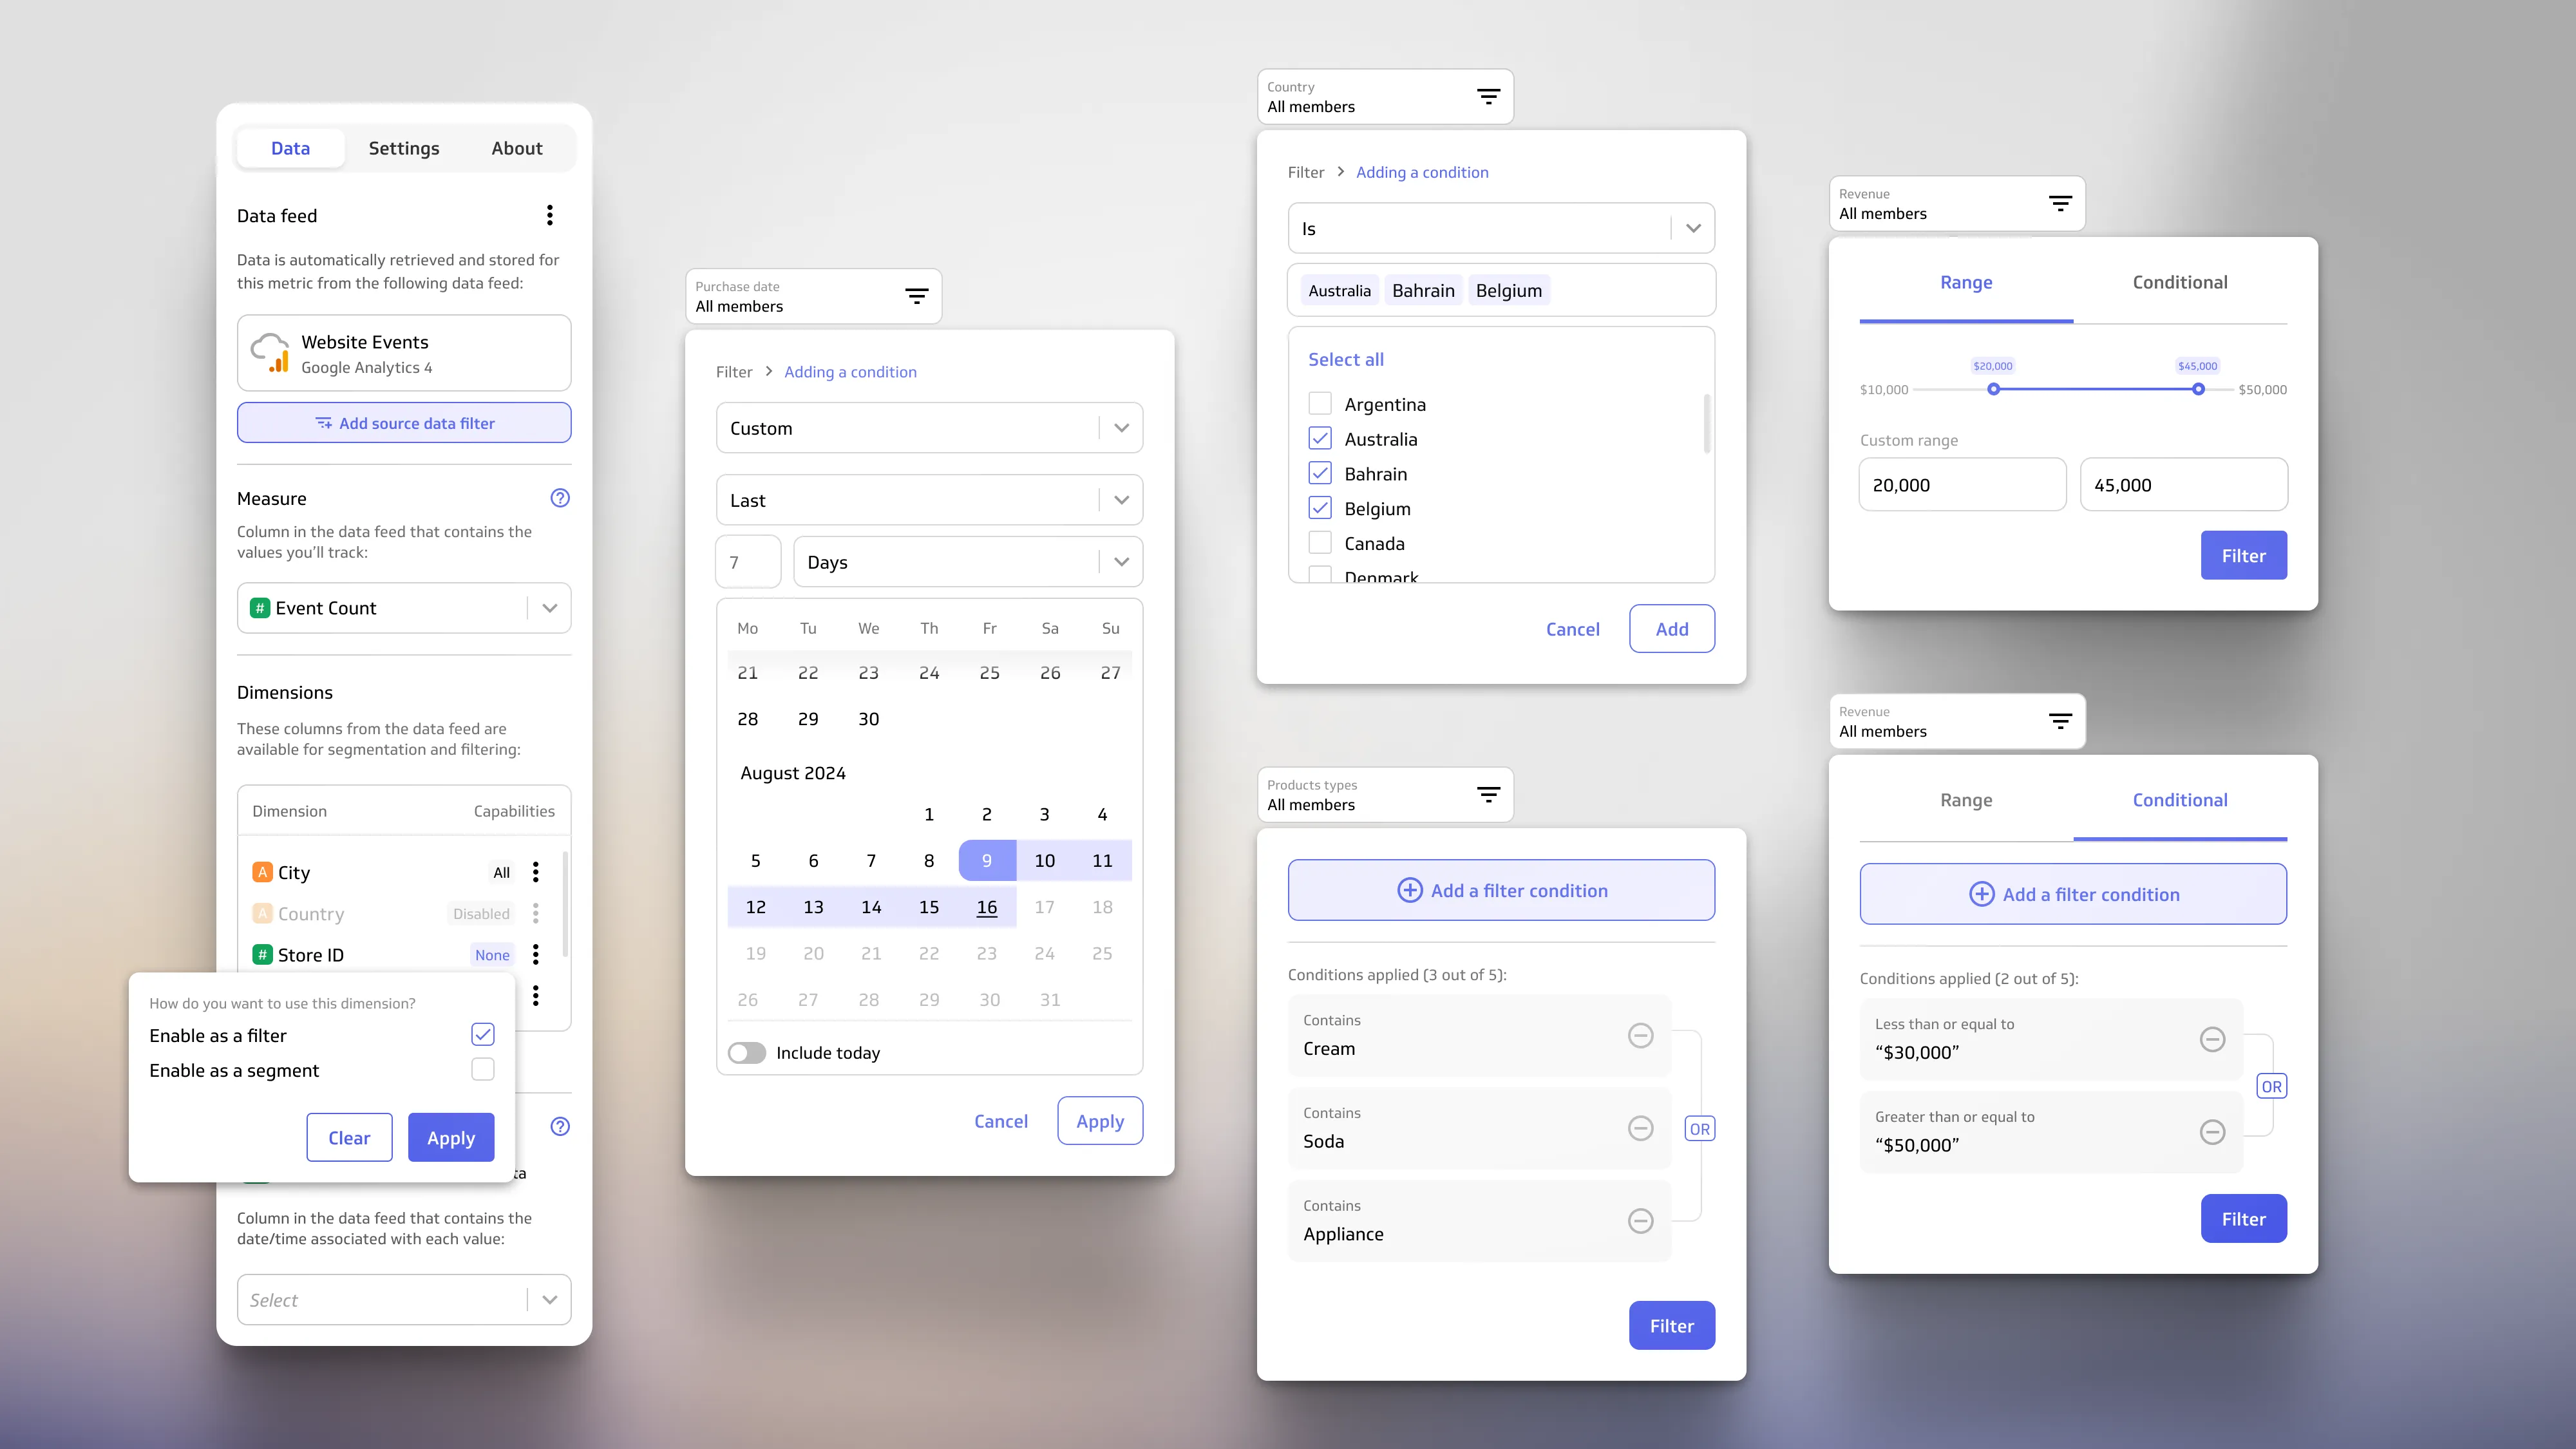
Proposed solution
We developed the Metric Explorer, a flexible environment that allows users to explore and analyze data in depth. By incorporating AI and leveraging advanced models, we created an intuitive solution that caters to all skill levels, enabling users to ask questions and gain actionable insights. Key components of this feature include:
- 1. Visualization Canvas
- 2. Analysis Tools
- 3. Exploration Sidebar
- 4. AI Assistant


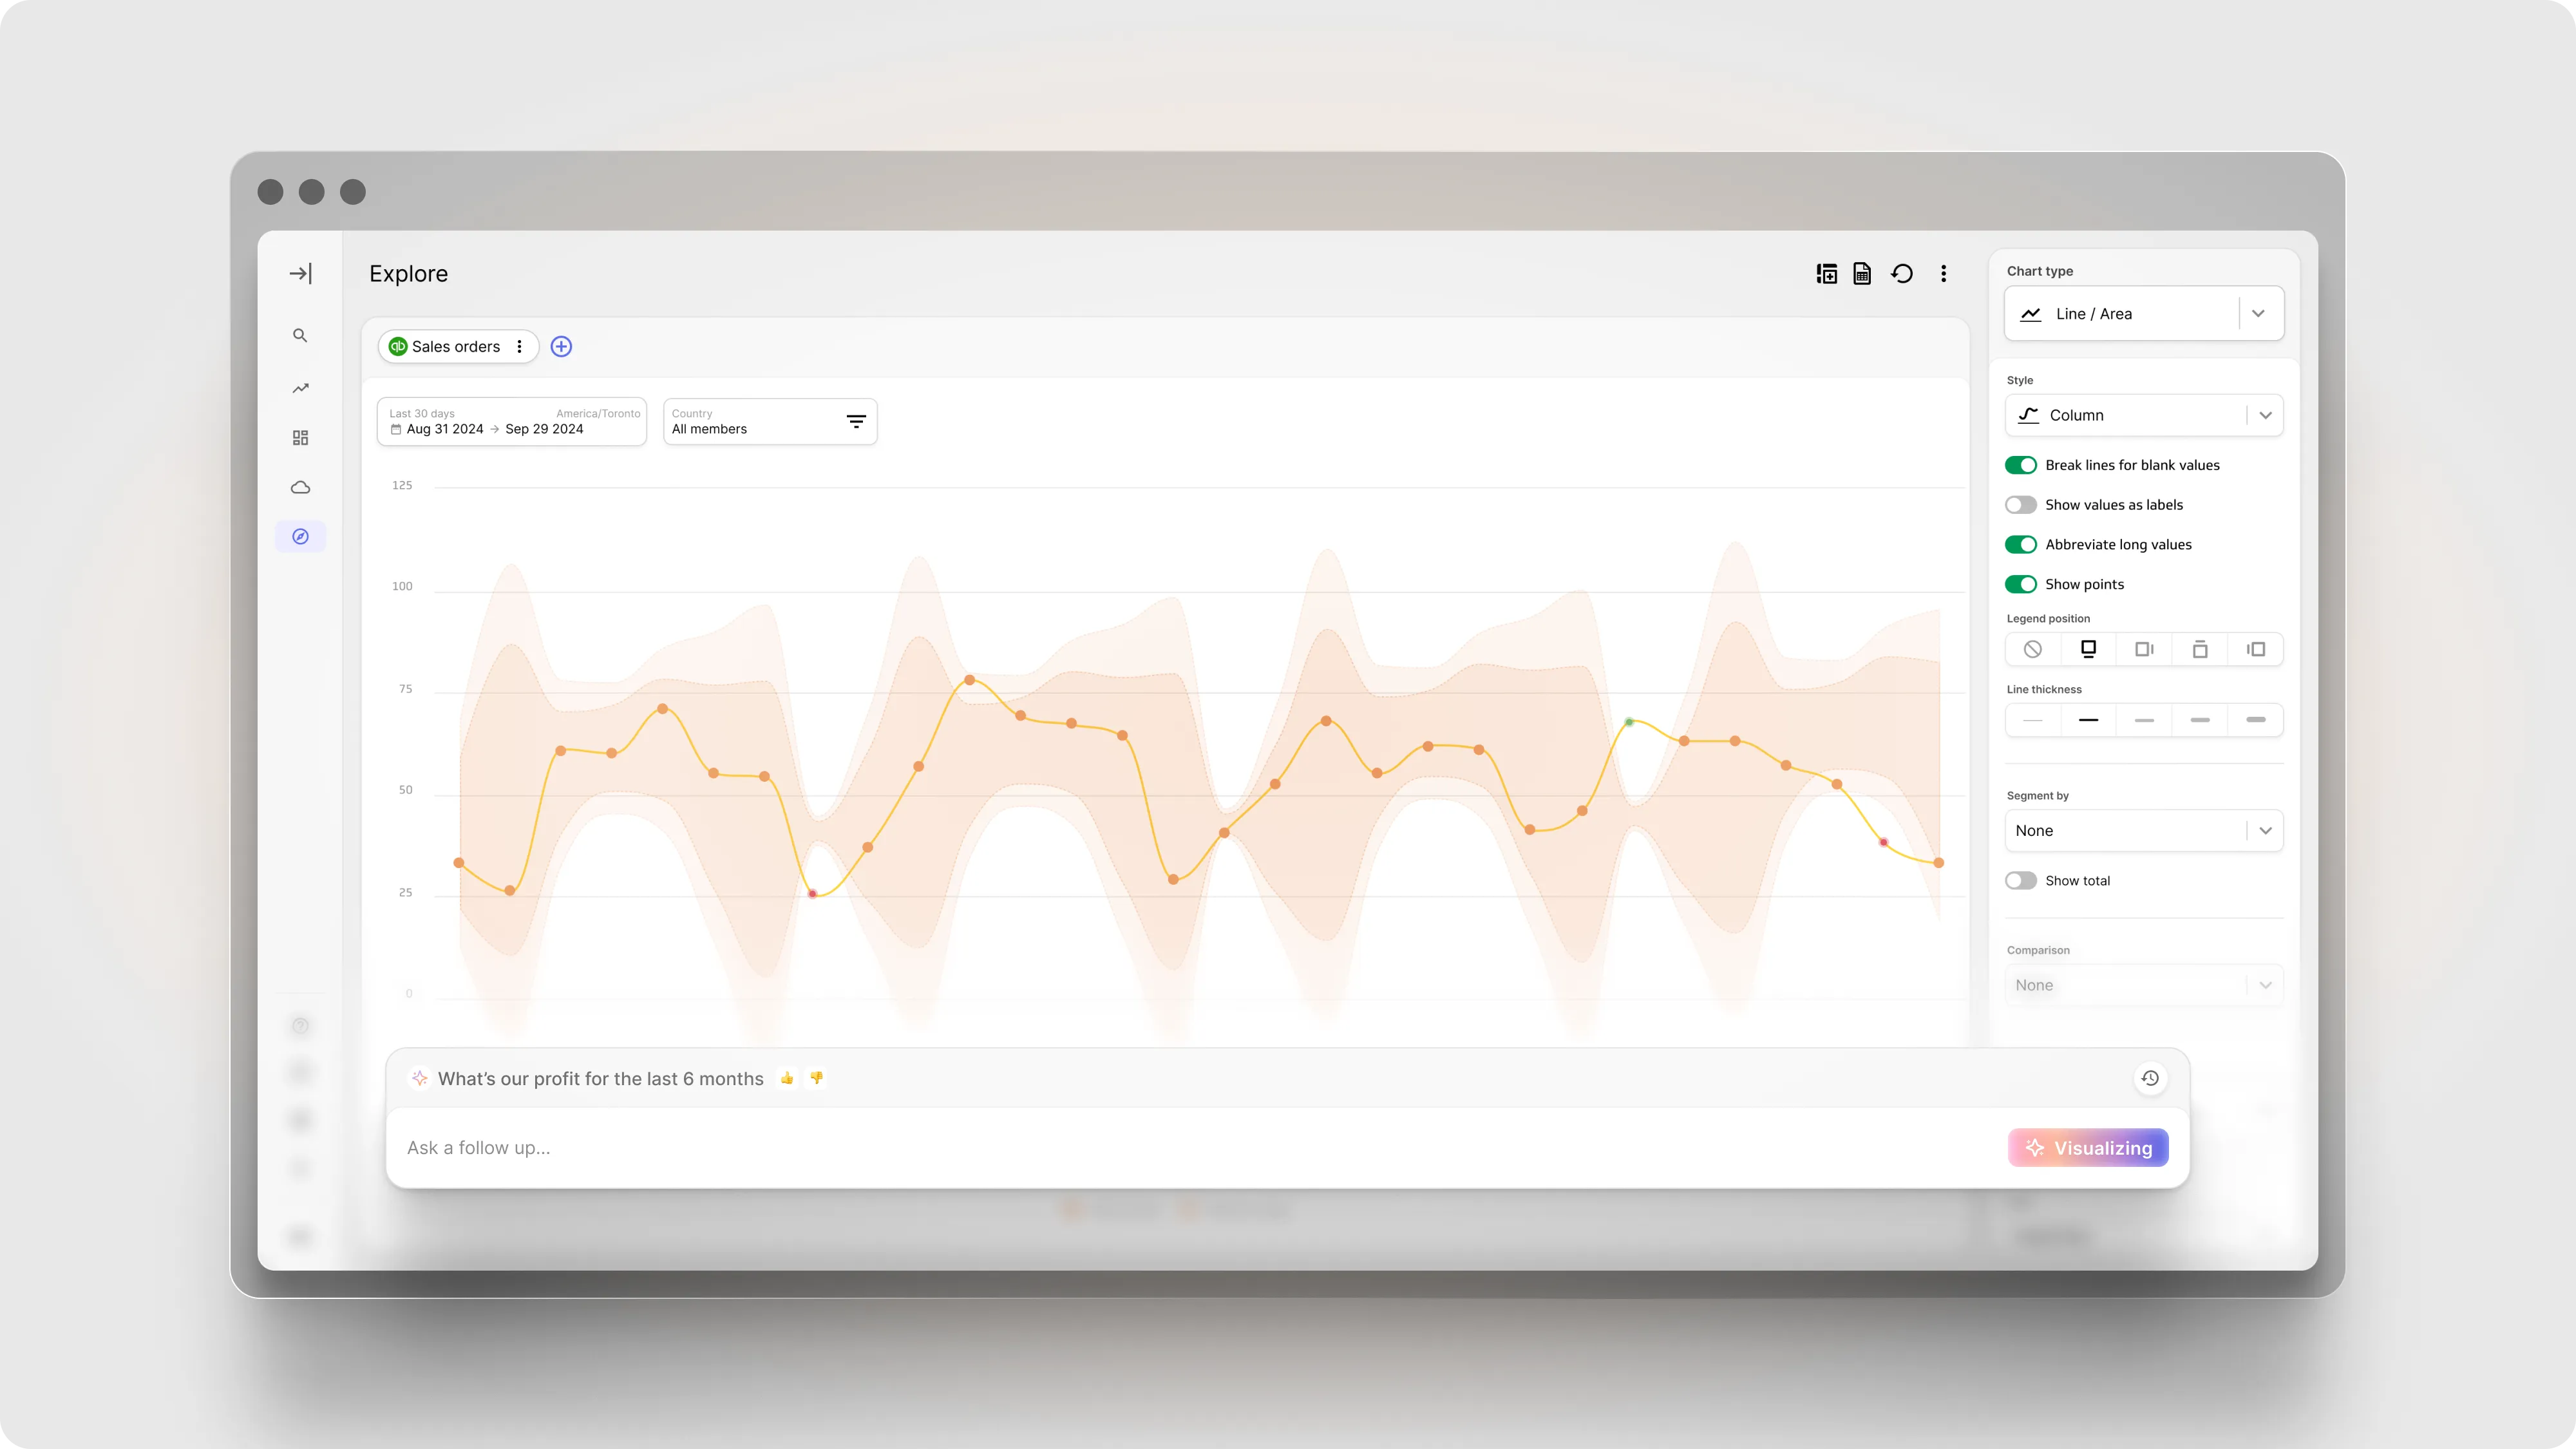
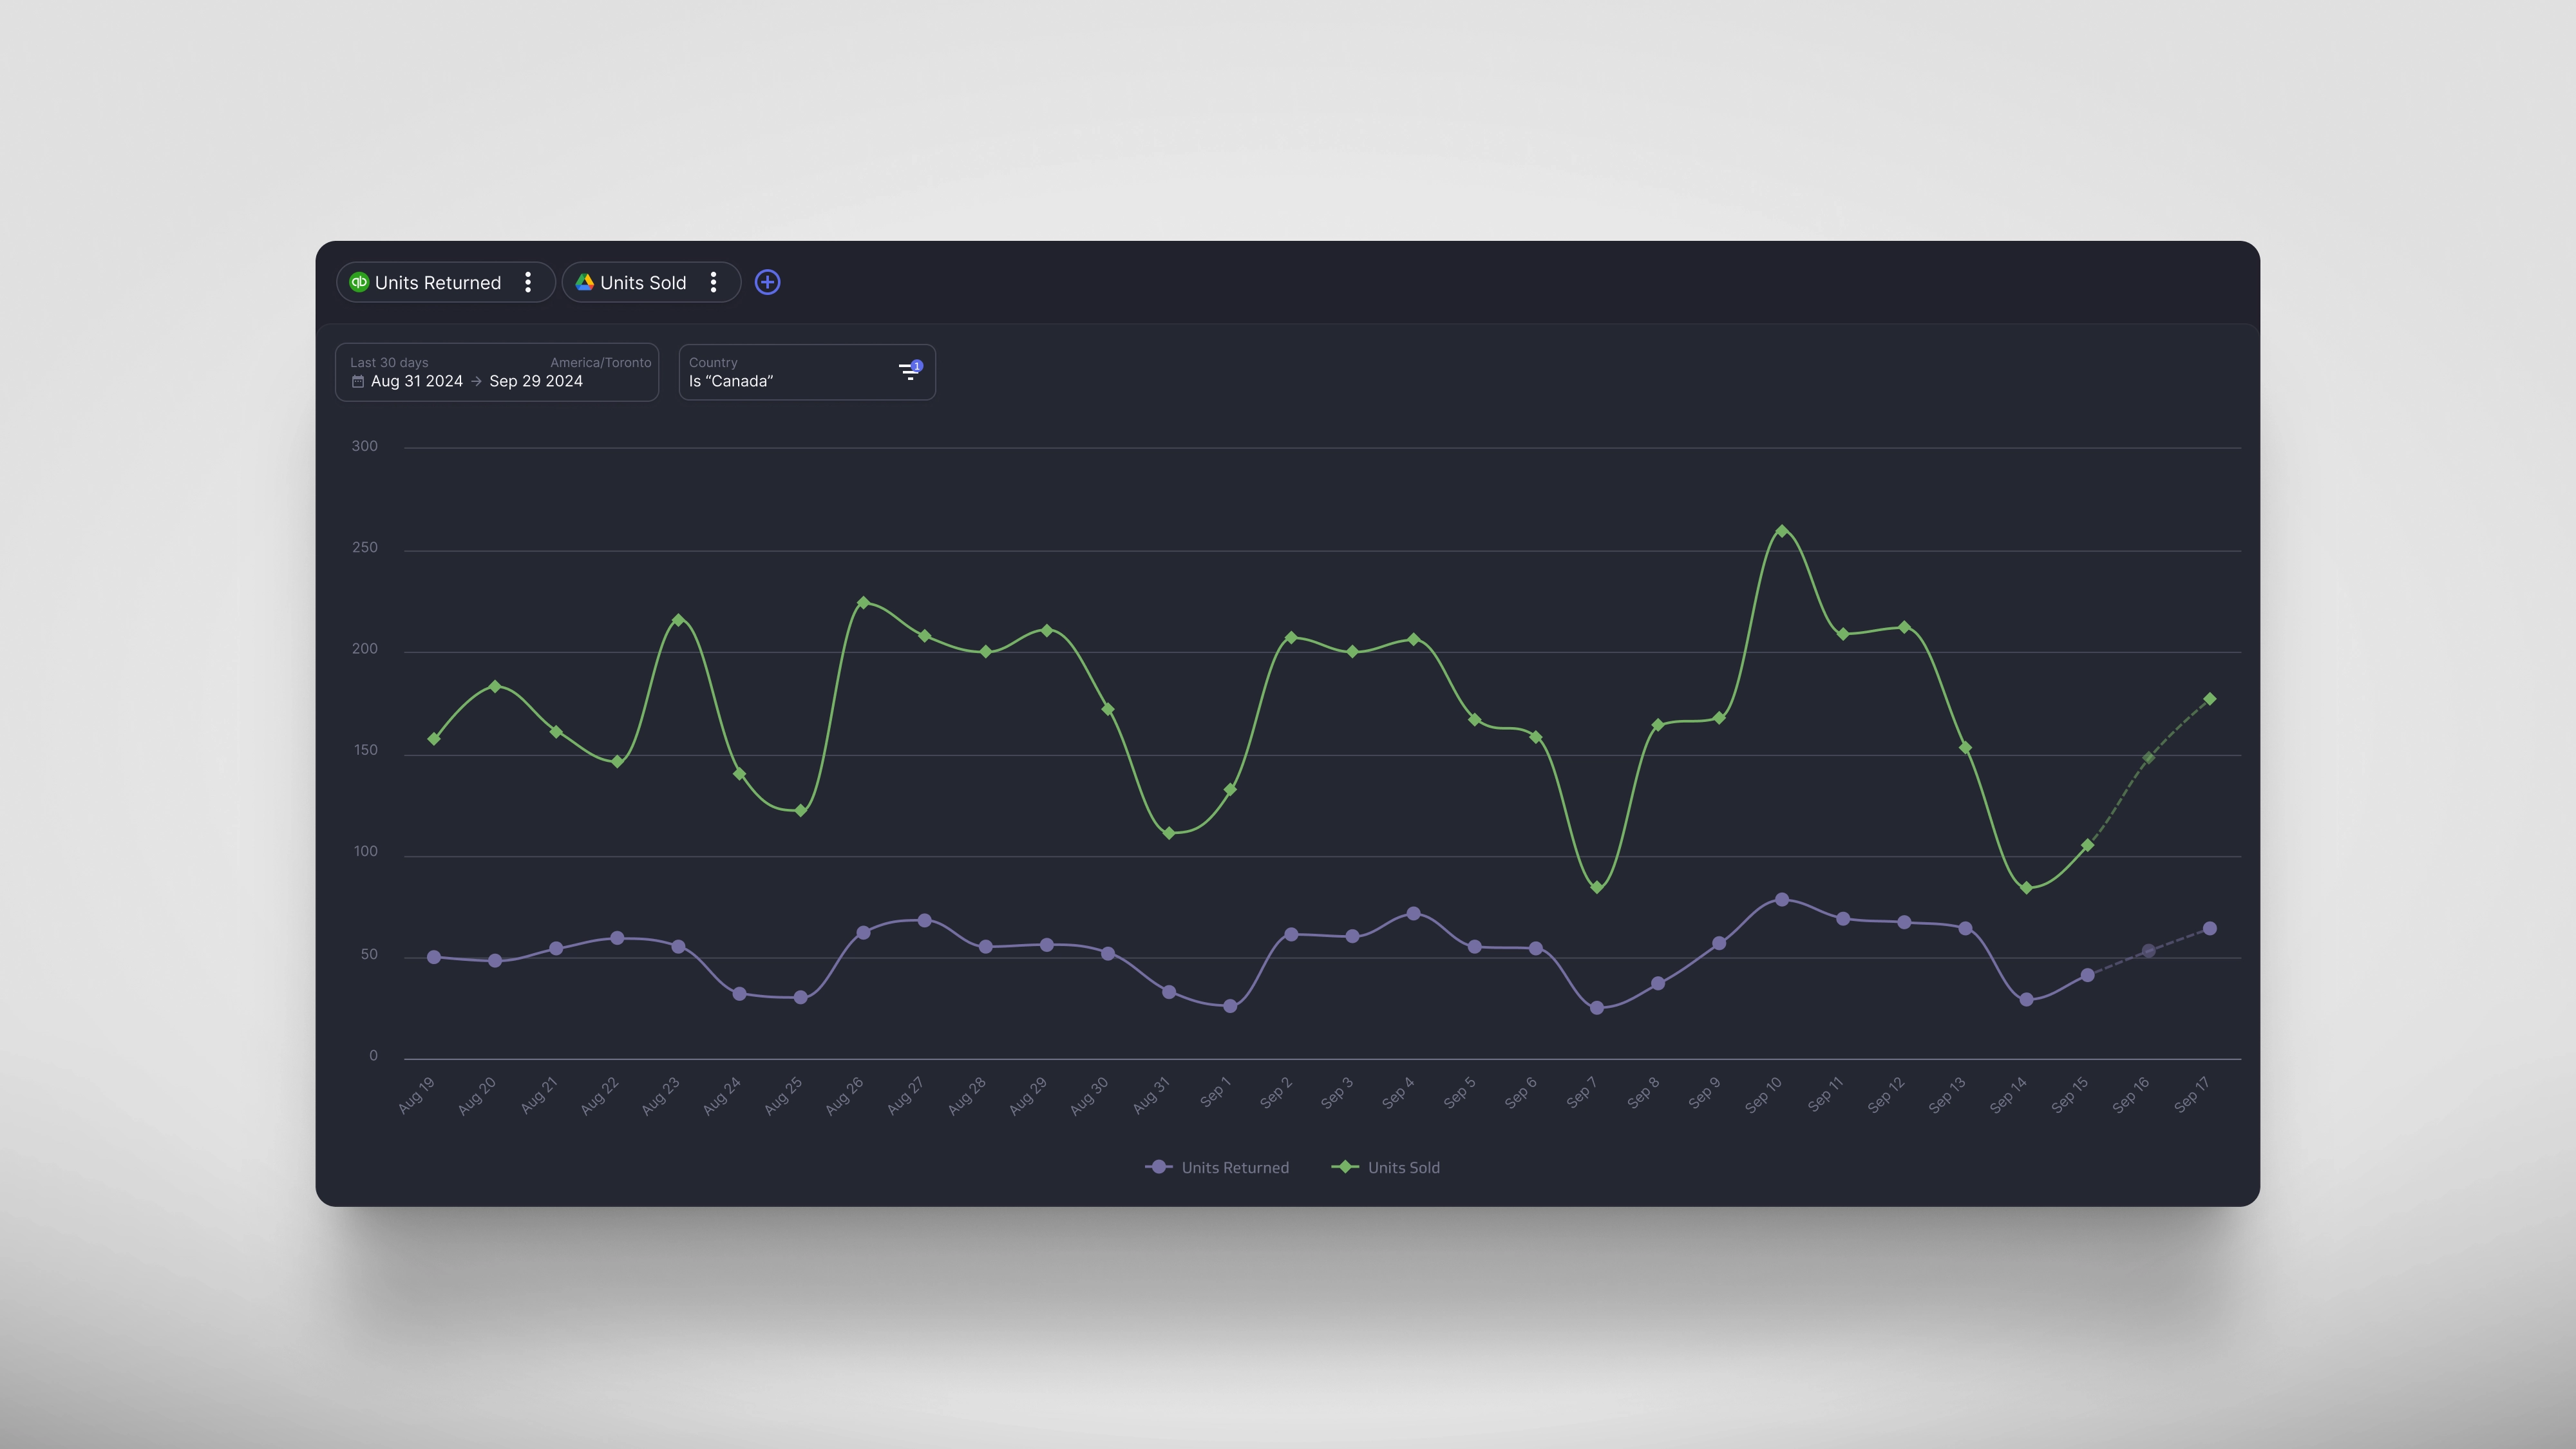
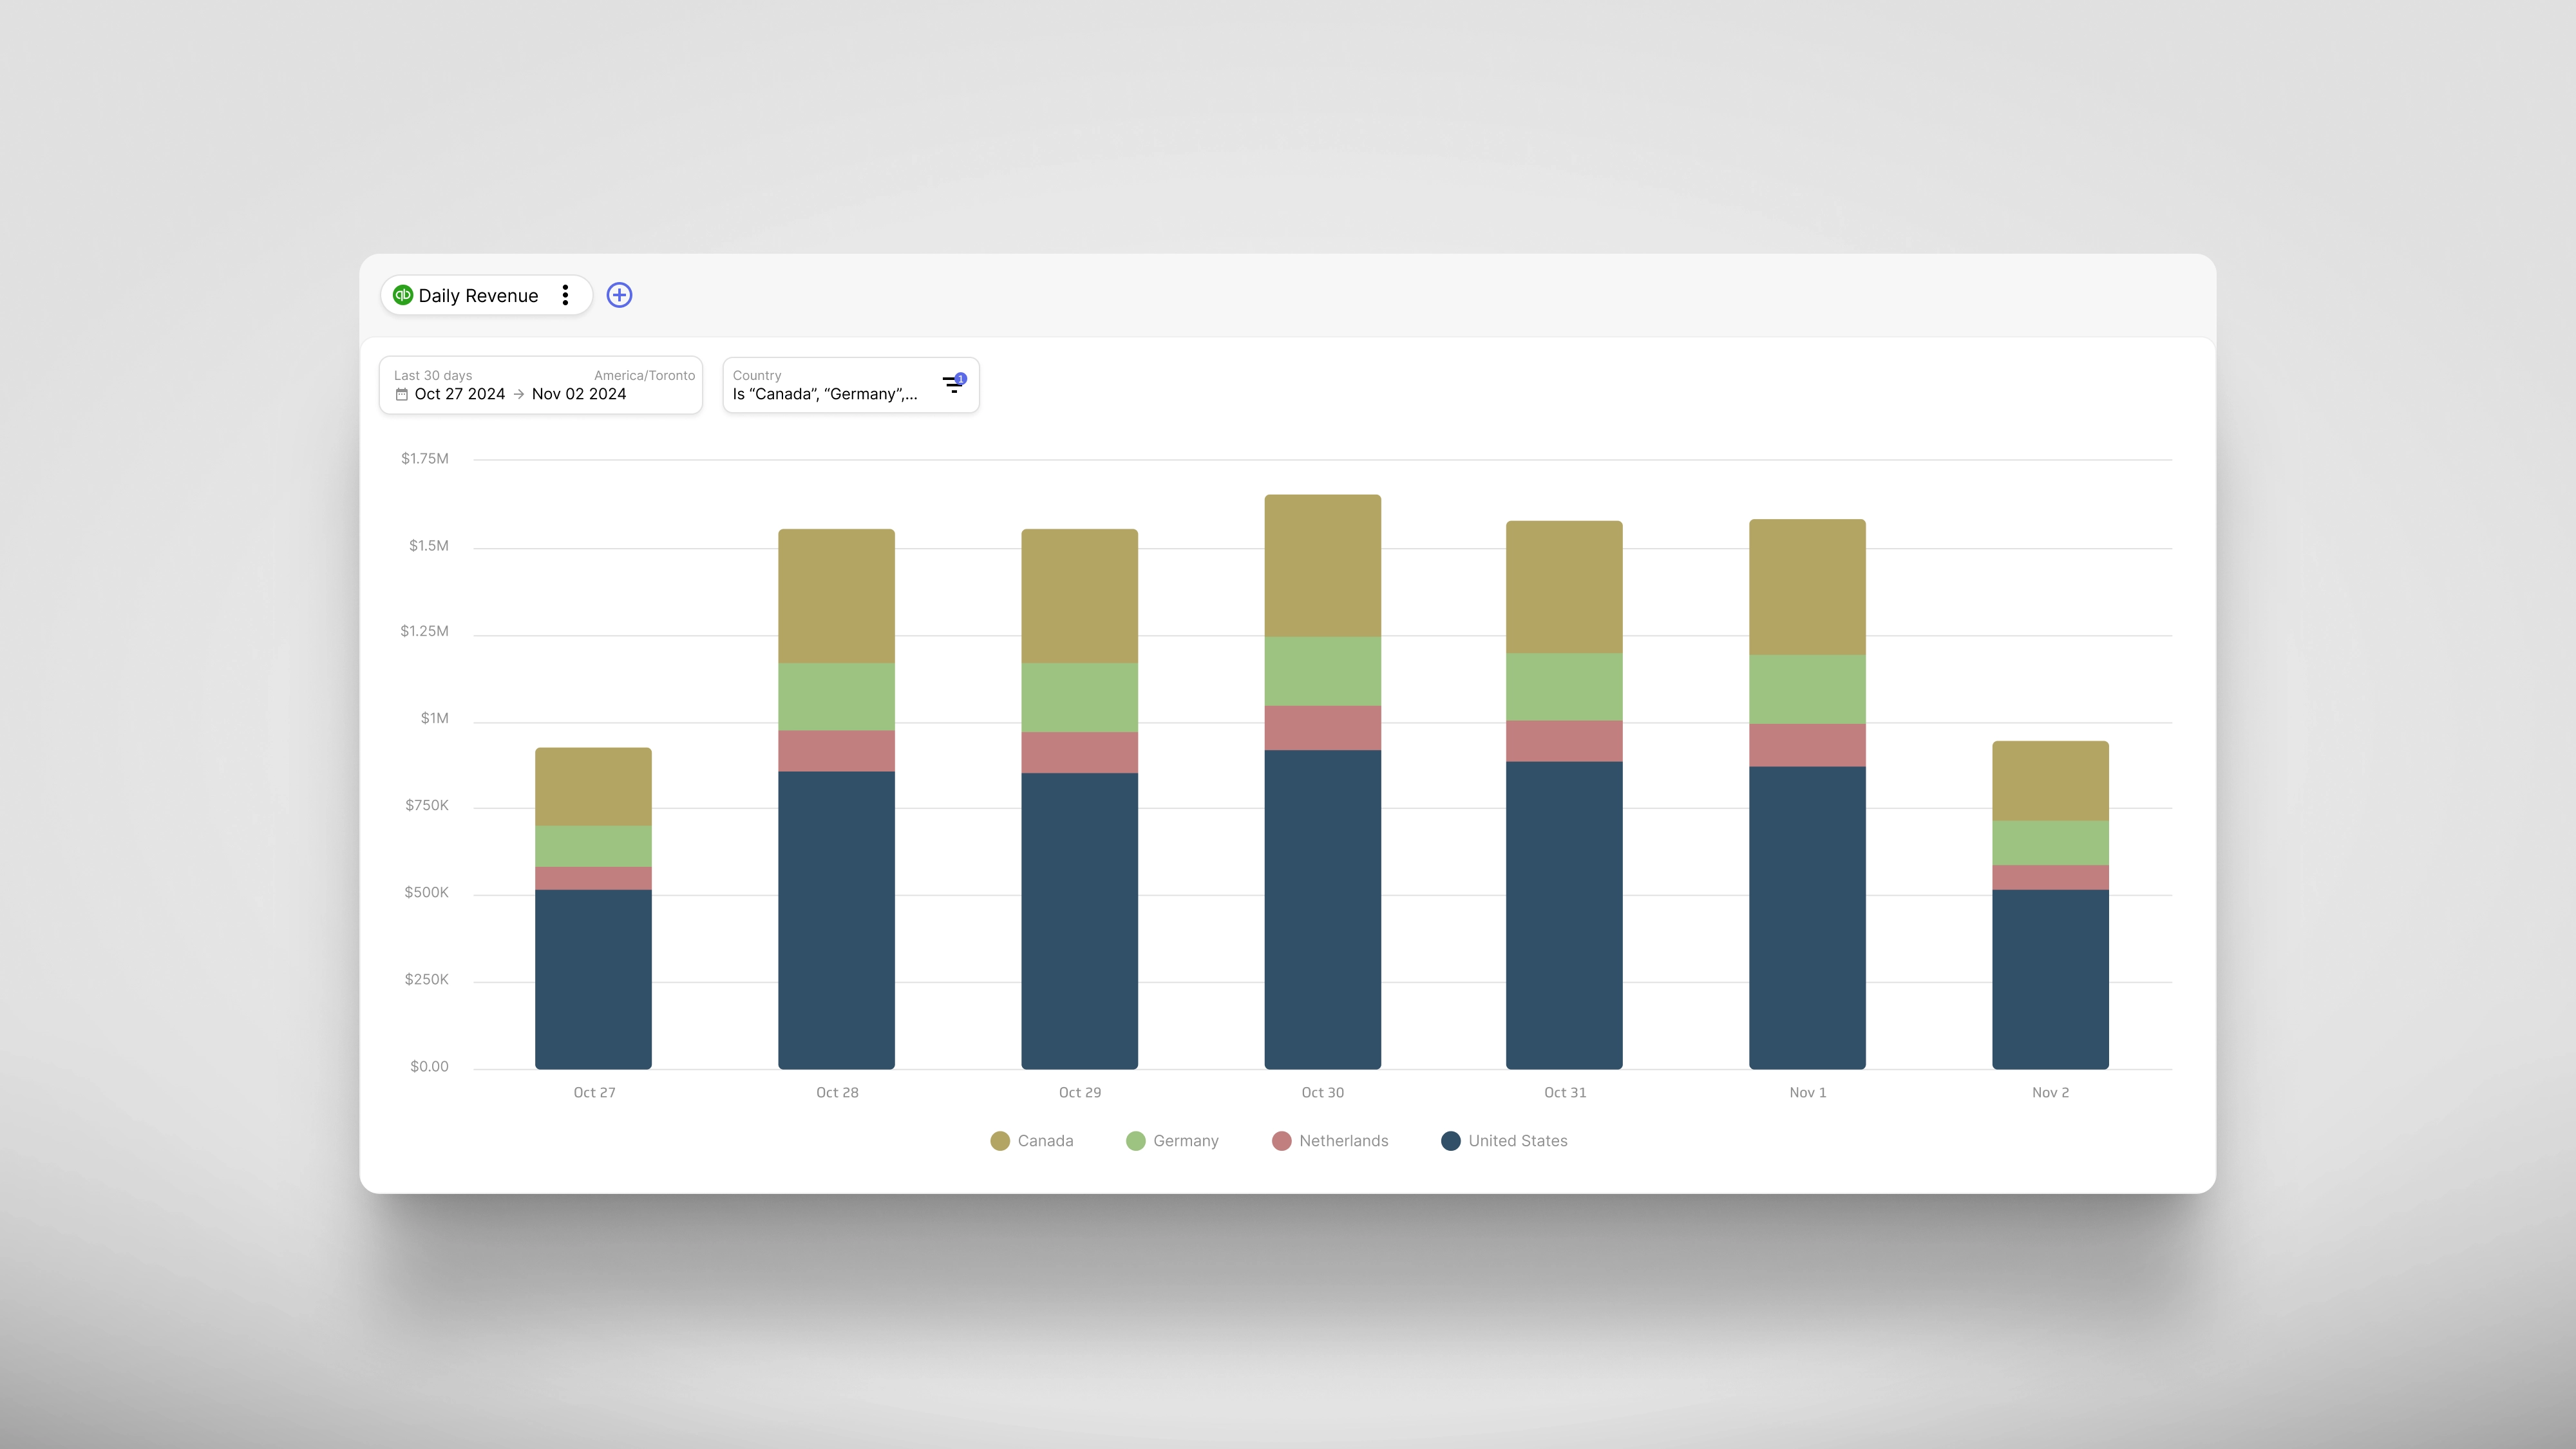
Visualization Canvas
An expansive exploration space that prioritizes visual clarity, giving users the room to fully capture and analyze every detail.
Key Features:
- Flexible canvas for in-depth visualization and insights.
- Support for visualizing multiple metrics simultaneously.
- Easy adjustment of filters and aggregations for deeper analysis.
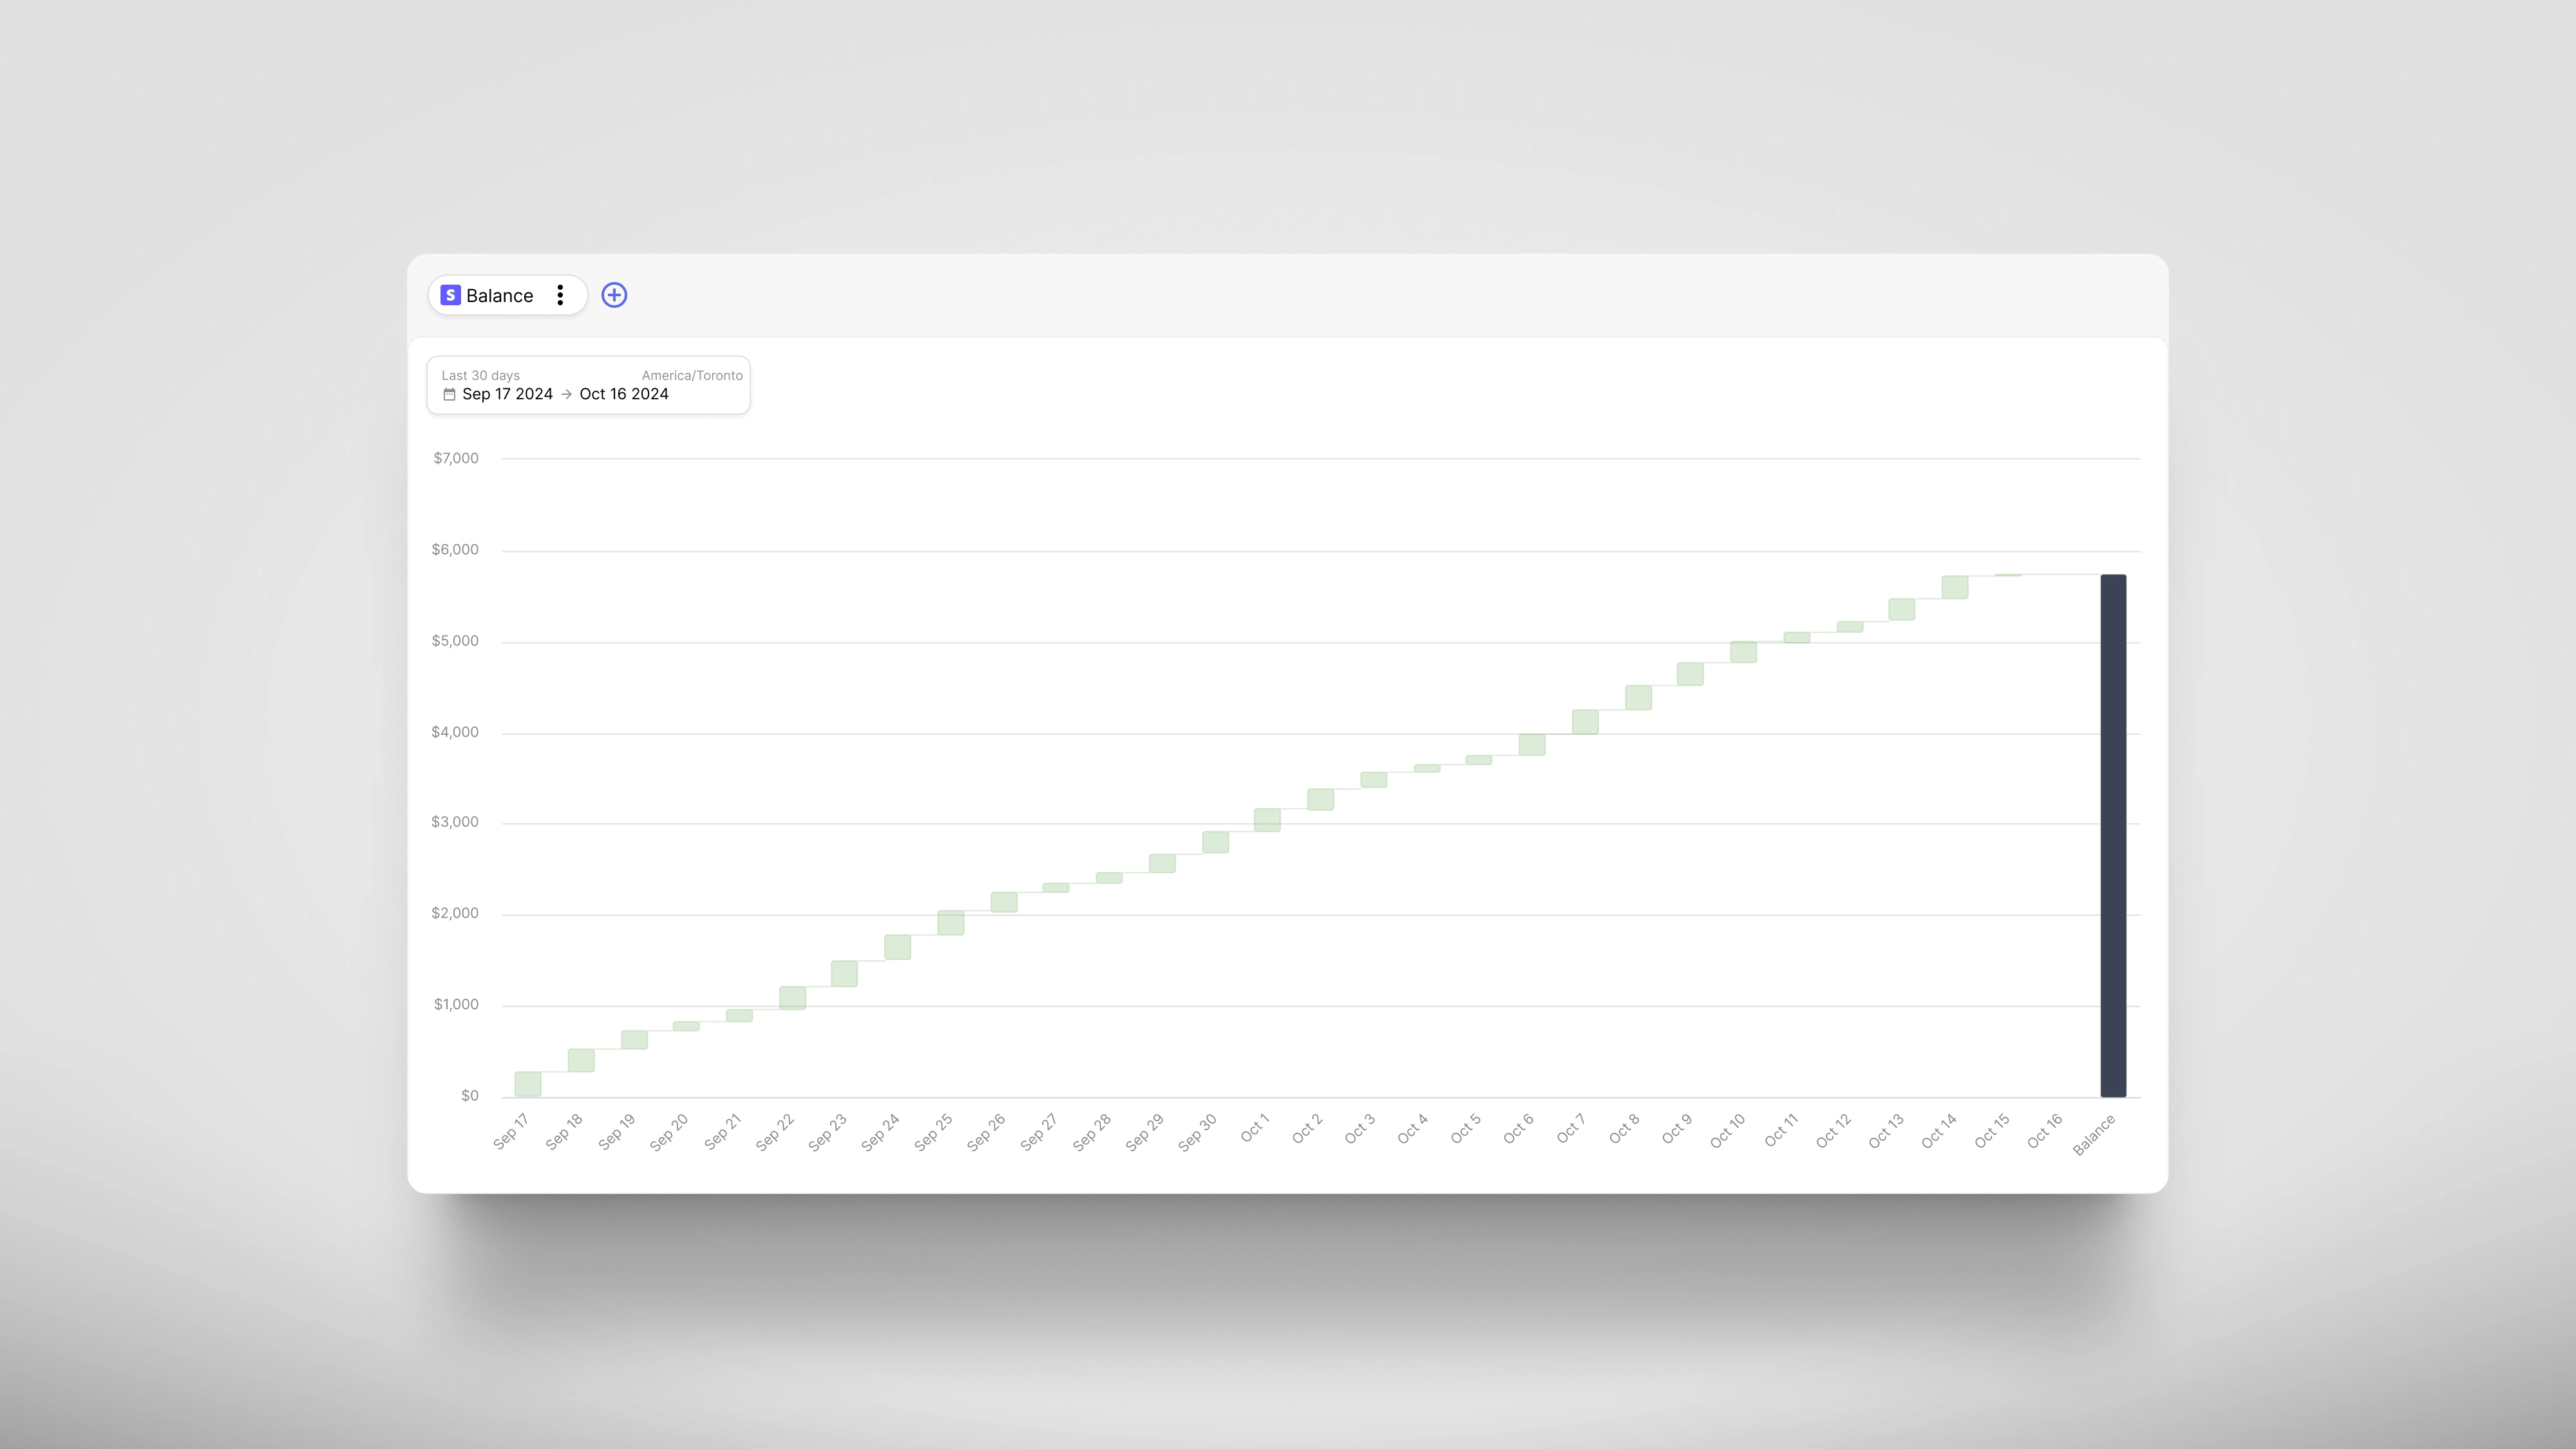
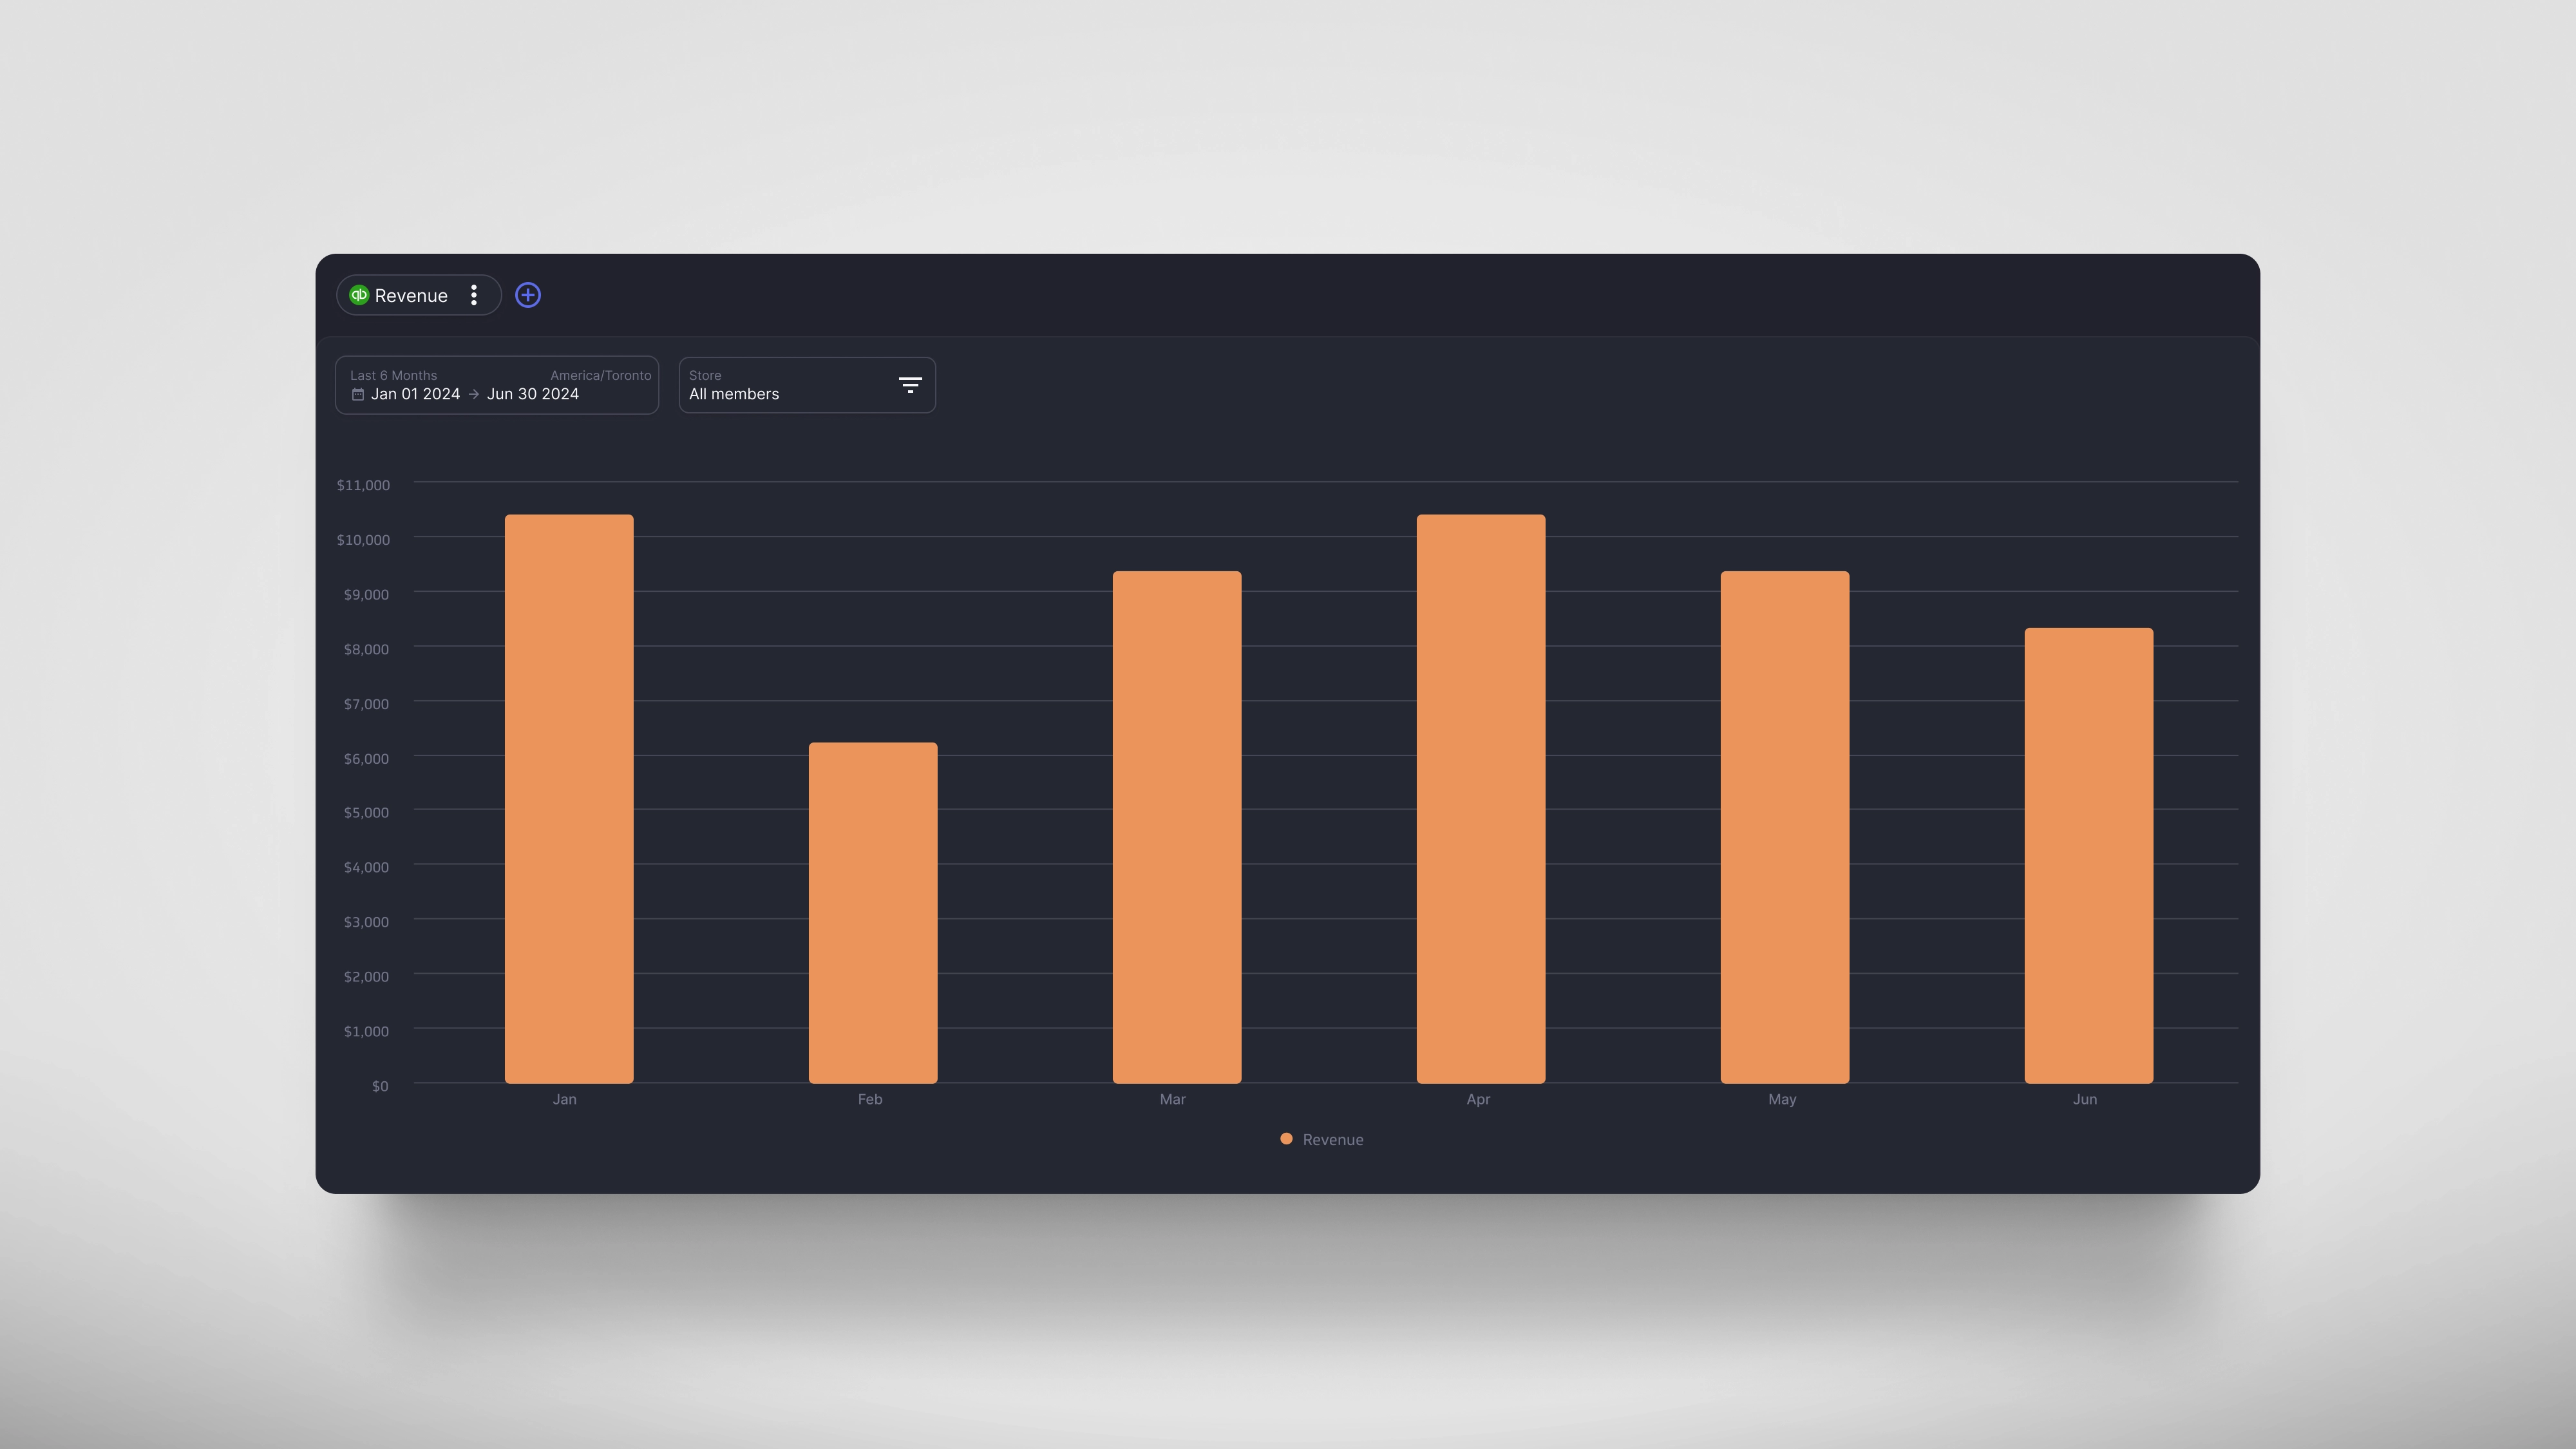
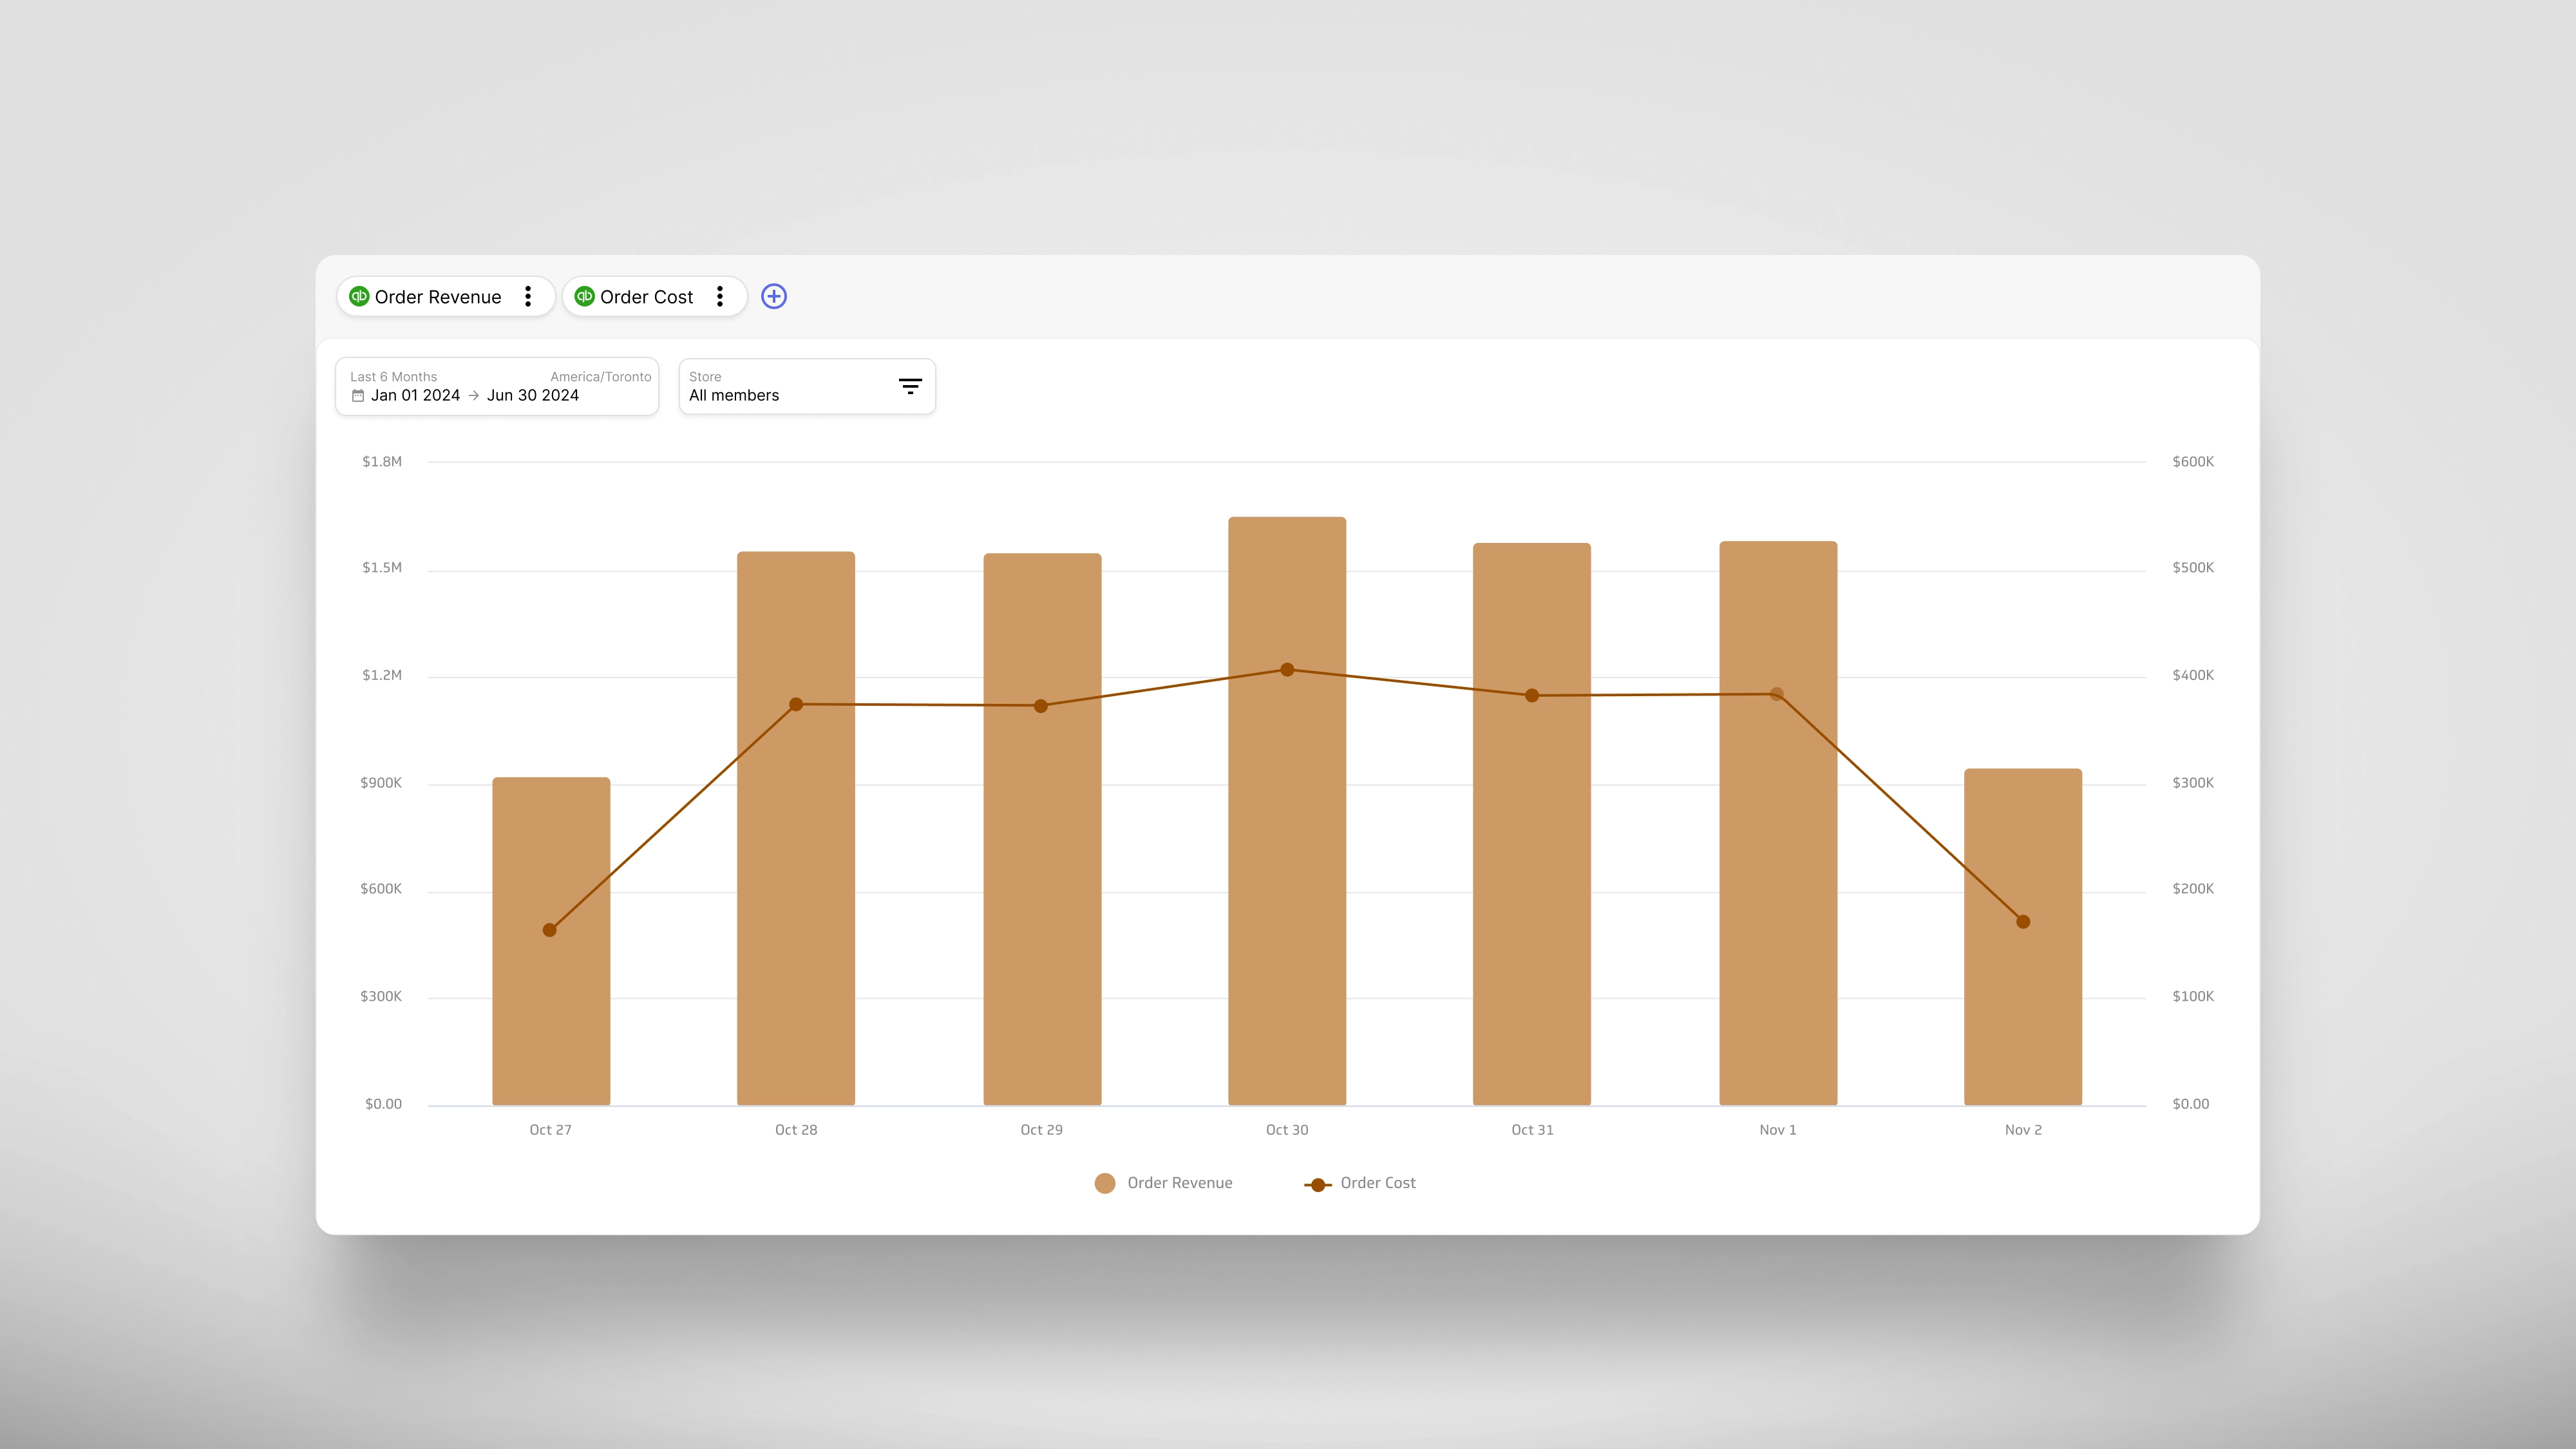


Analysis tools
Effective decision-making starts with understanding both current performance and future projections of your key business metrics.
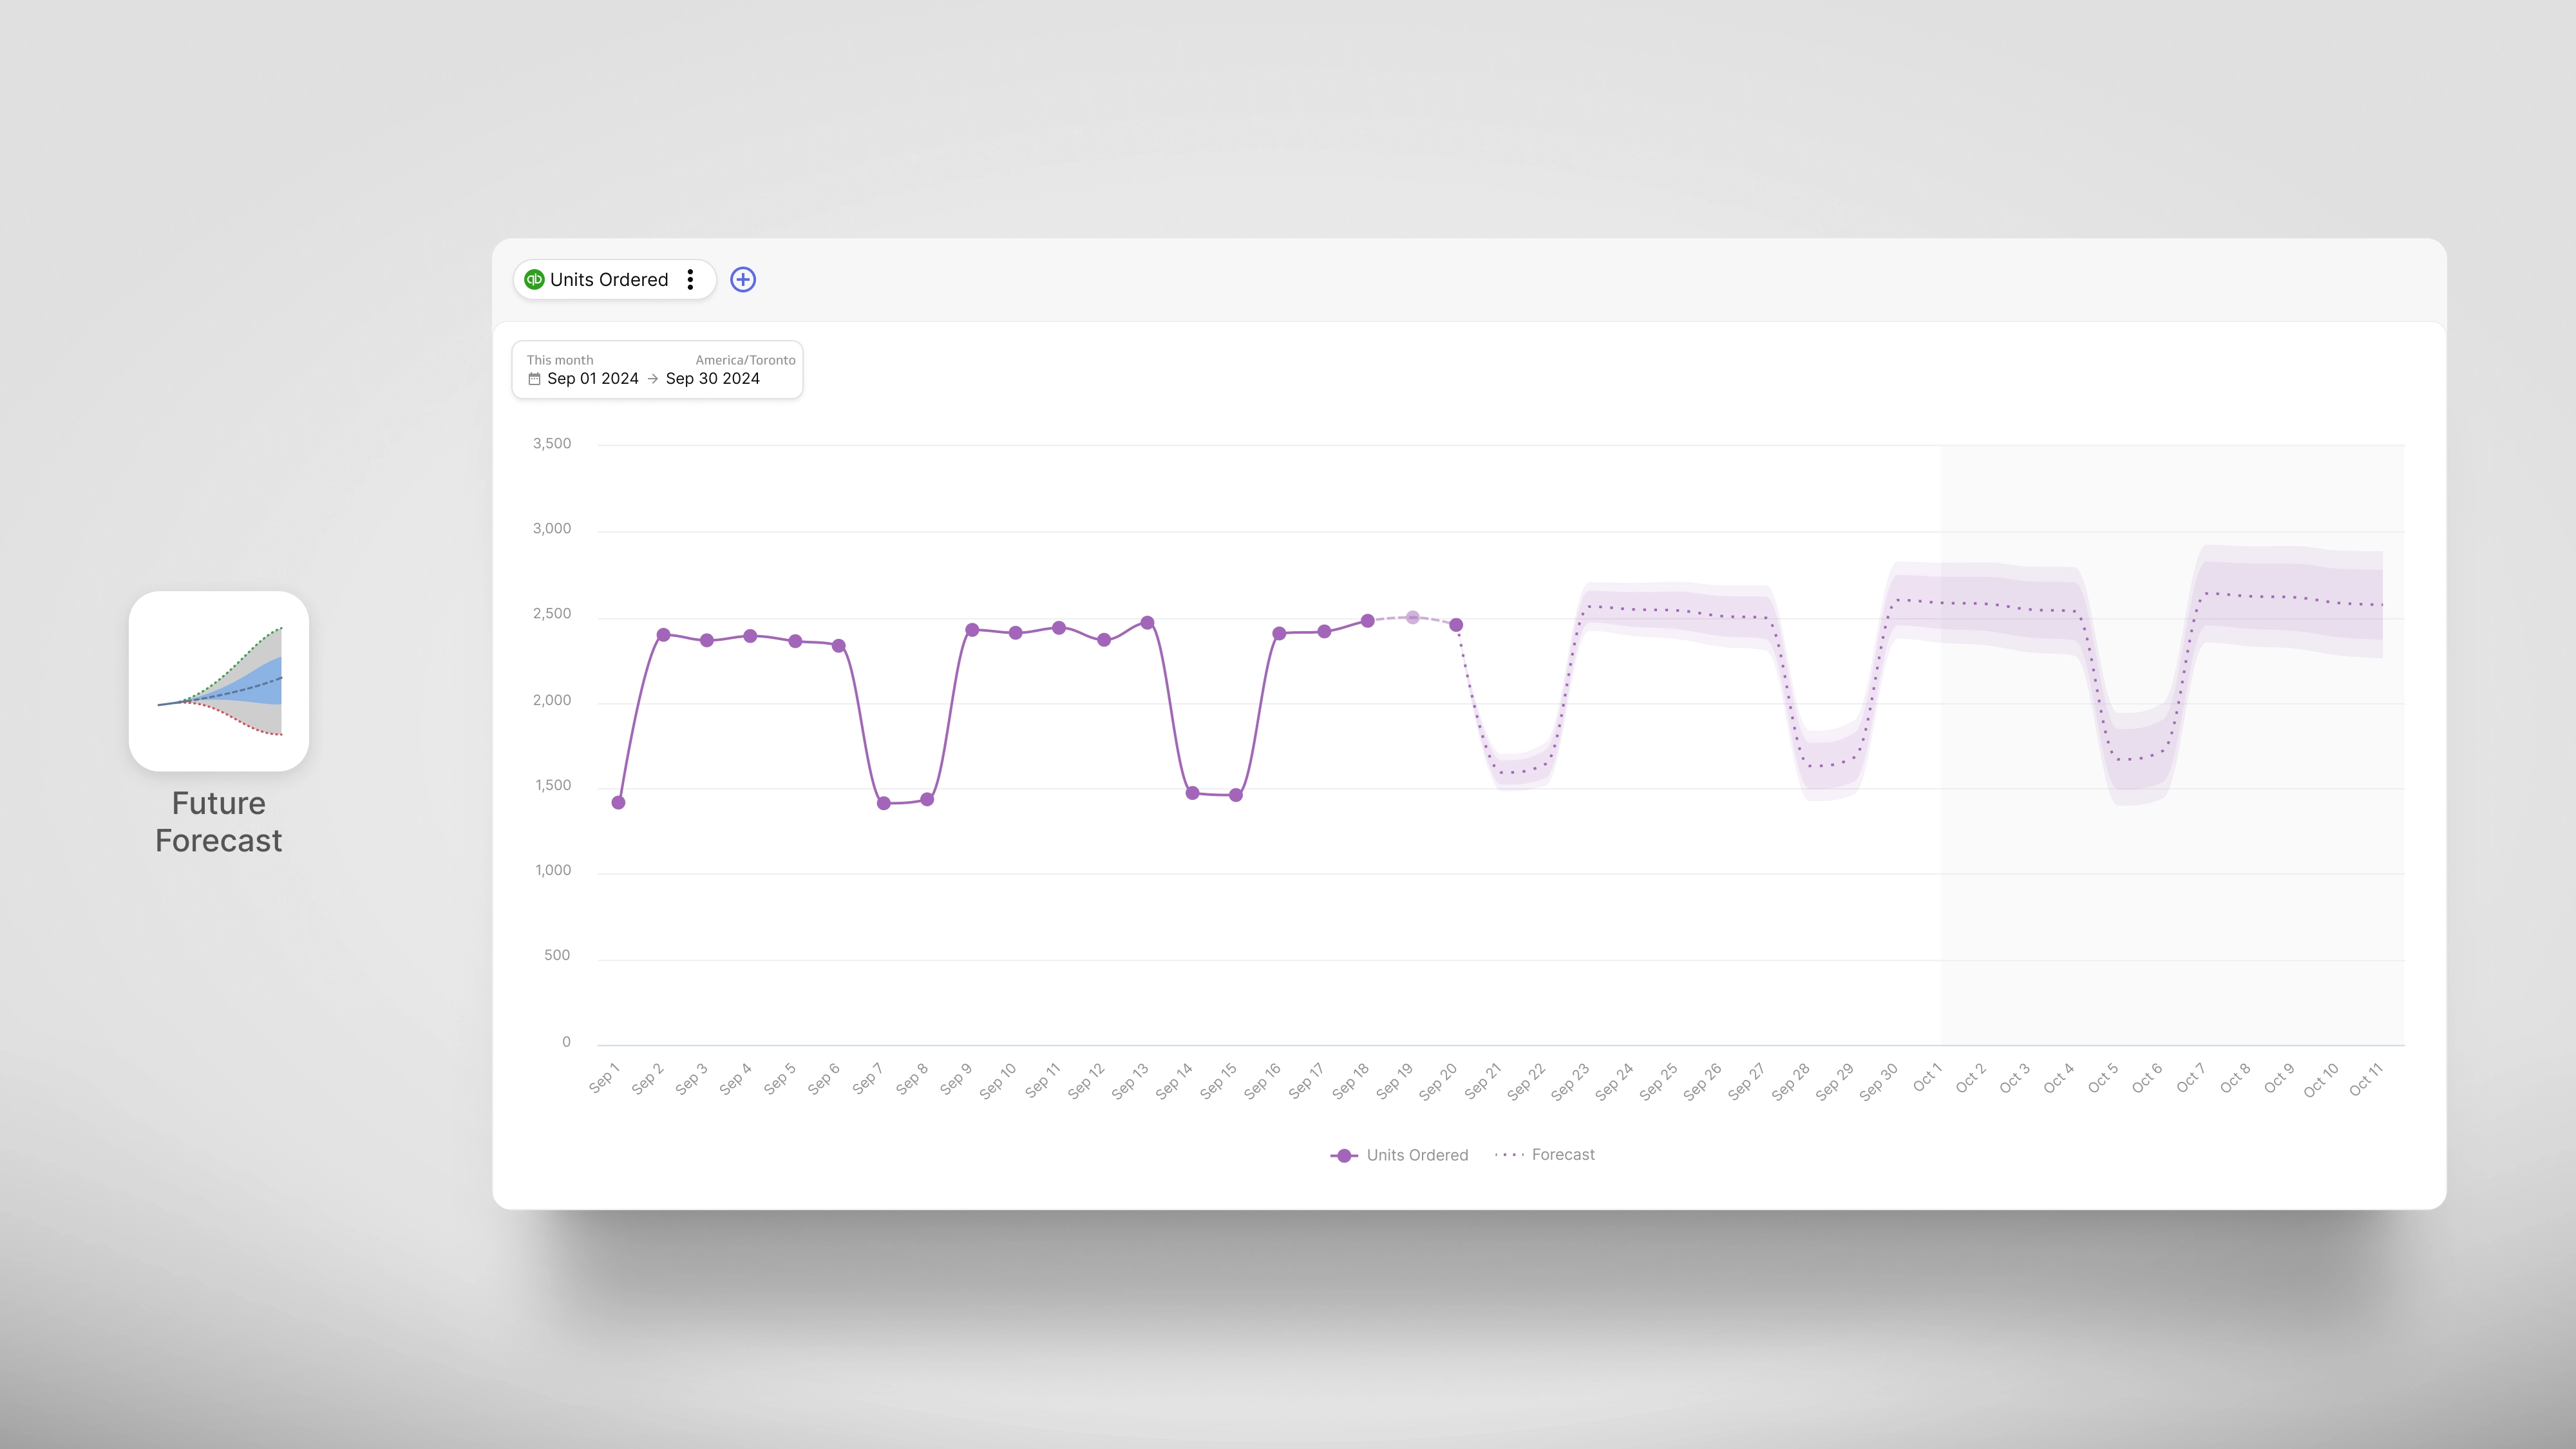
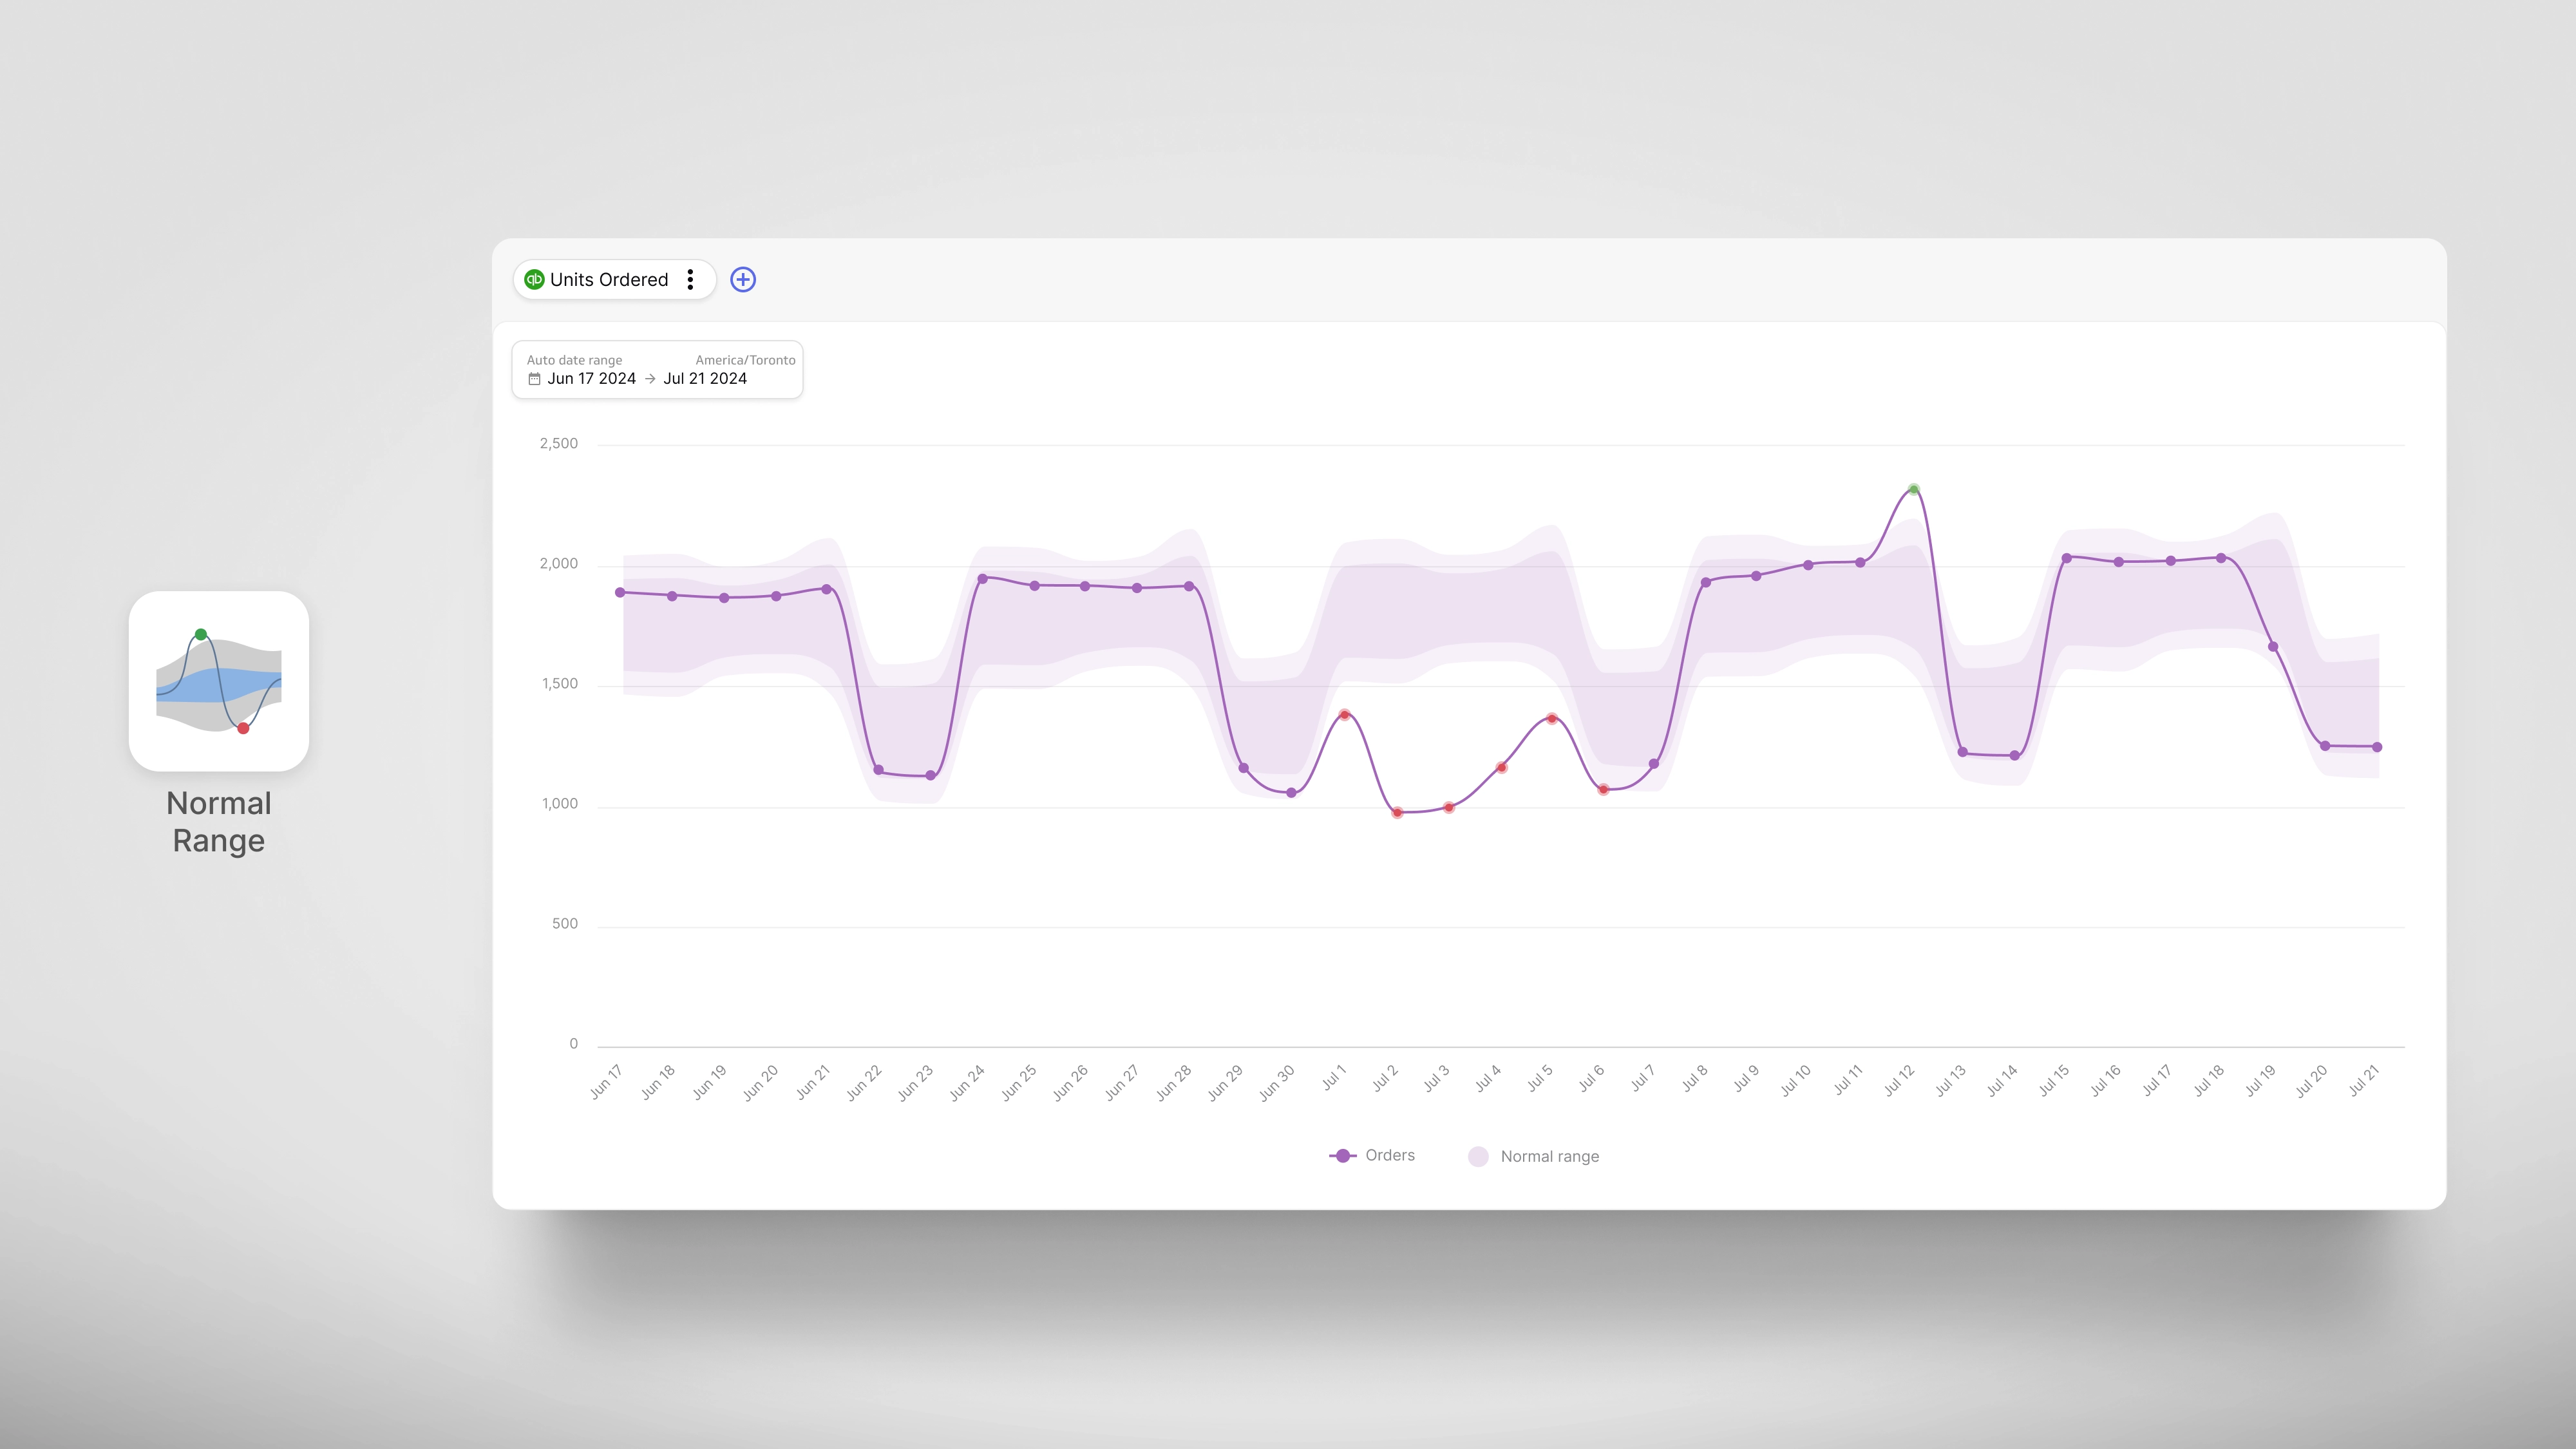
Tools like normal range and forecast analysis enable you to assess past, present, and future trends. Quickly identify outliers and predict future performance with ease.
Analysis Types:
- Future Forecast: Predicts future performance based on past data trends within a specified time period.
- Normal Range: Displays expected value ranges by analyzing natural variations in past data.
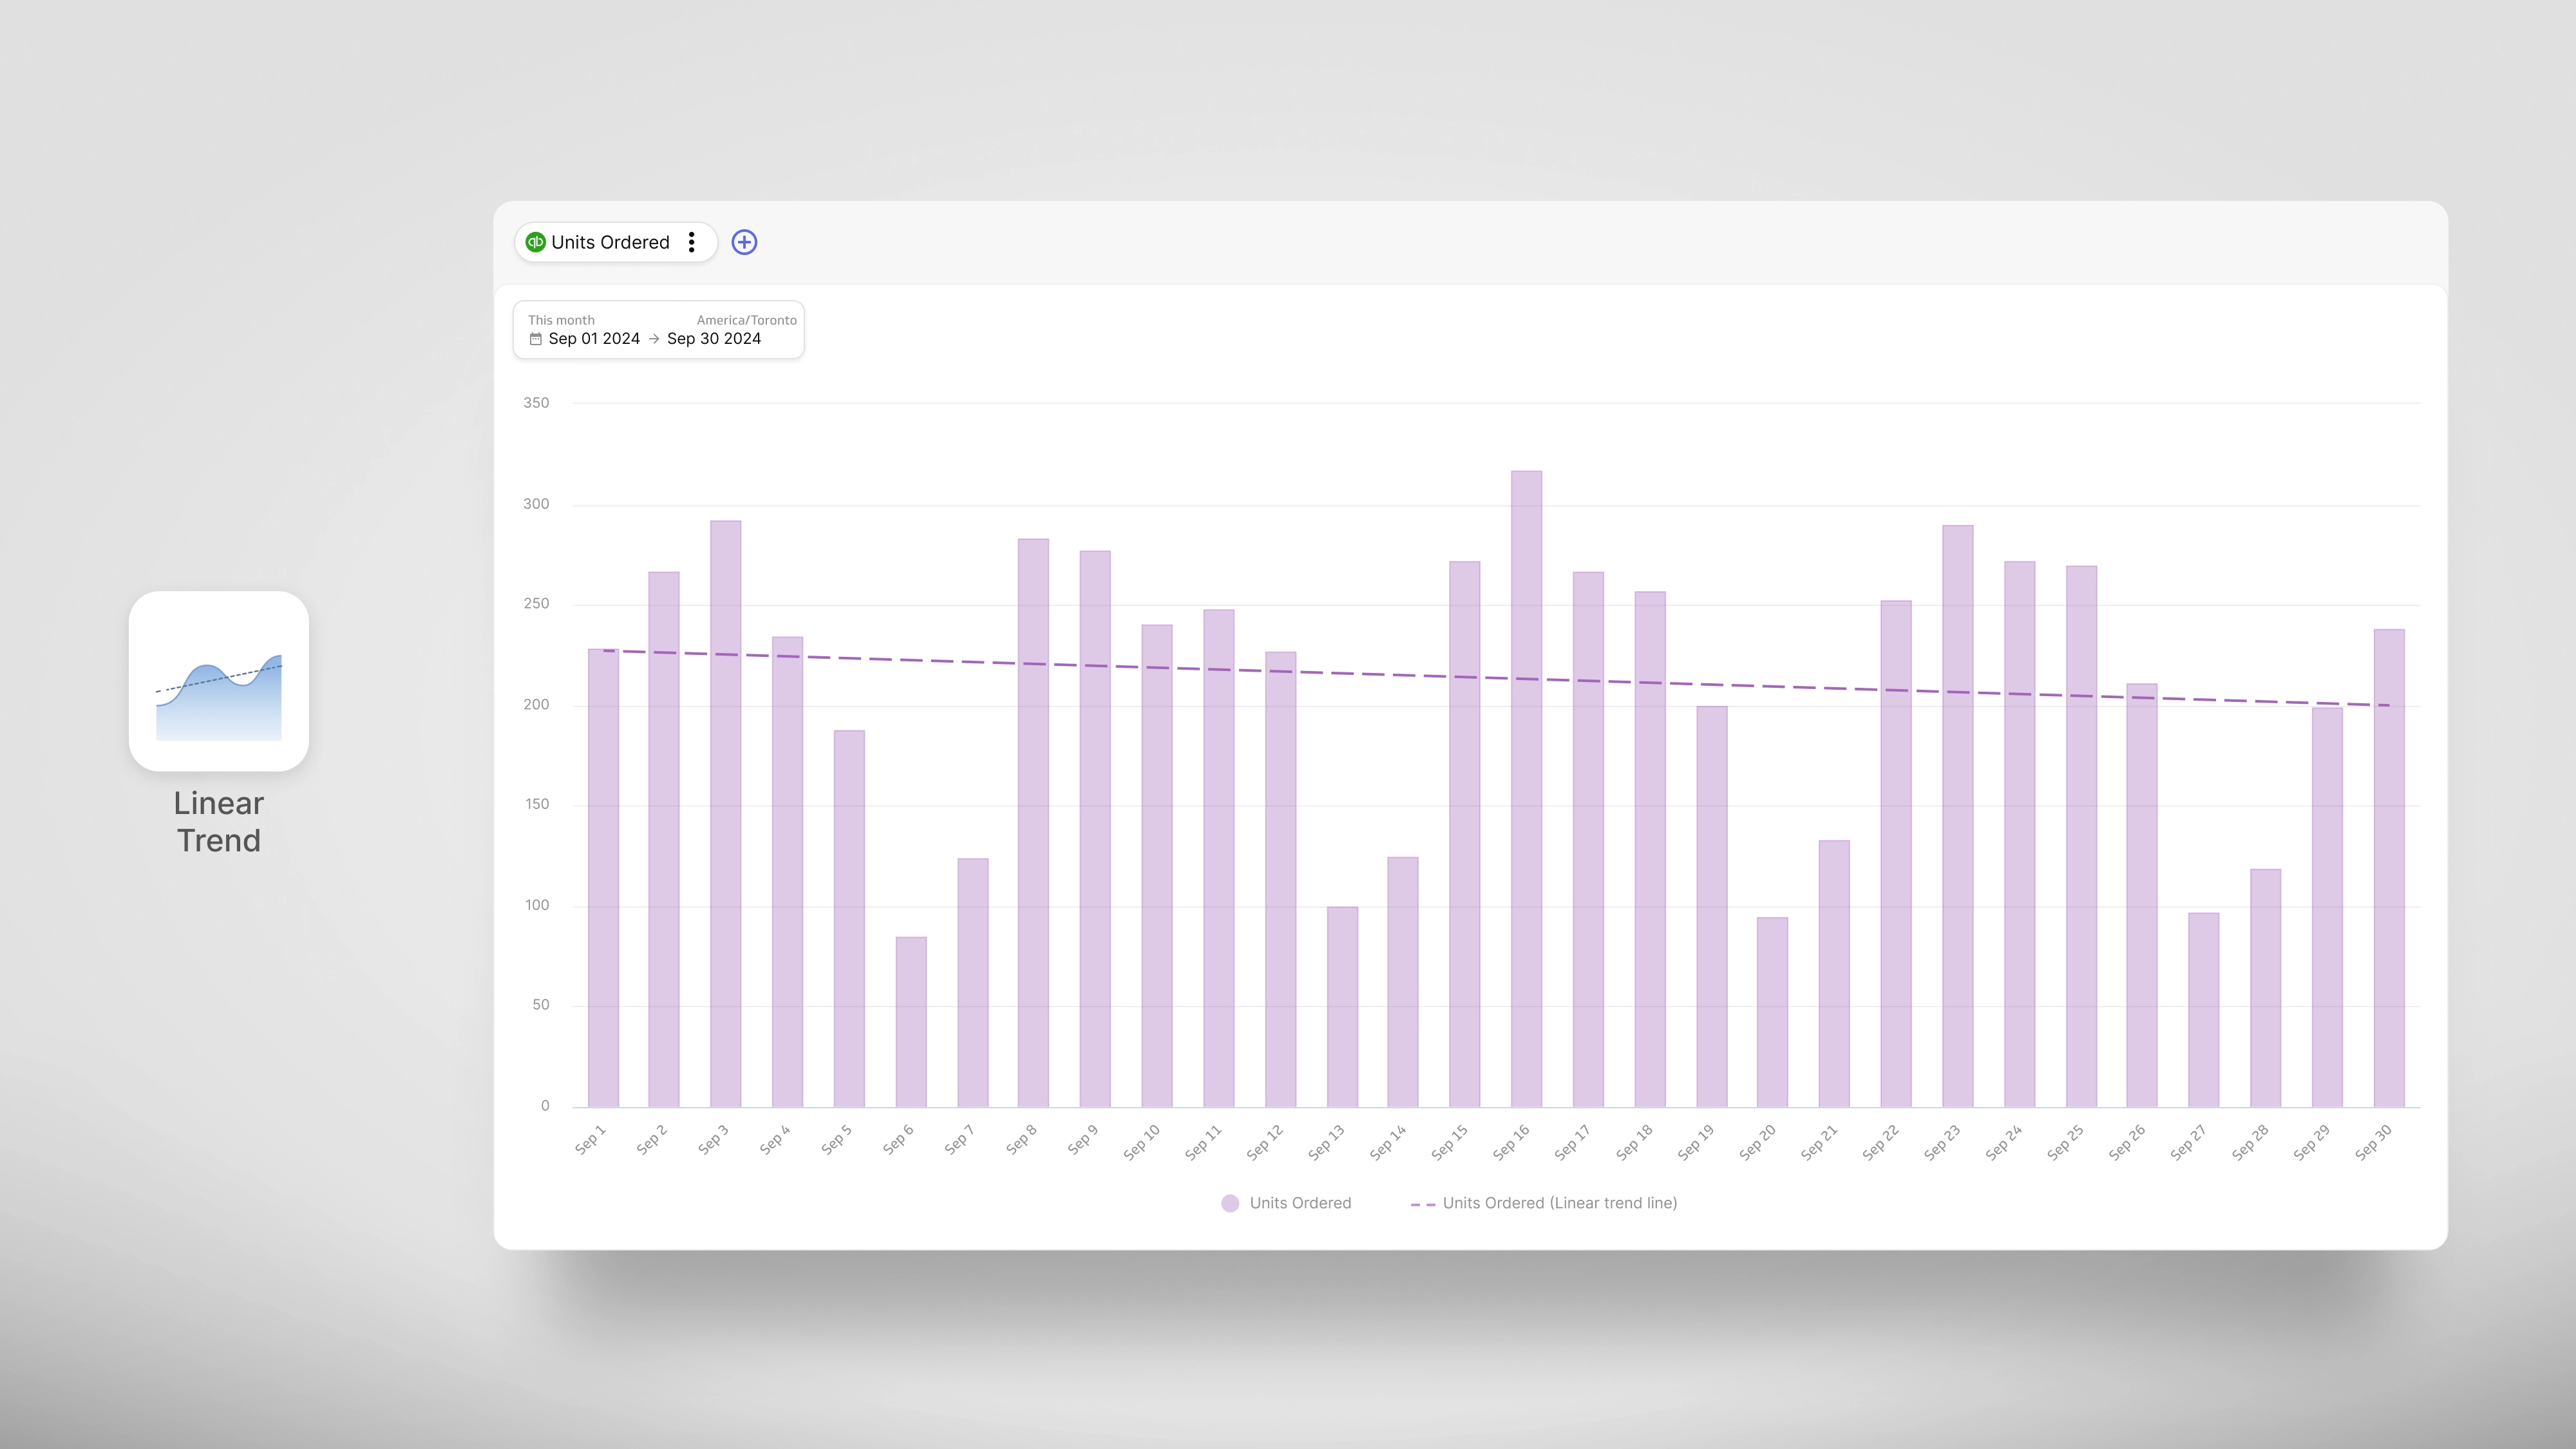
- Linear Trend: Clearly shows the trend’s direction with a positive or negative slope.
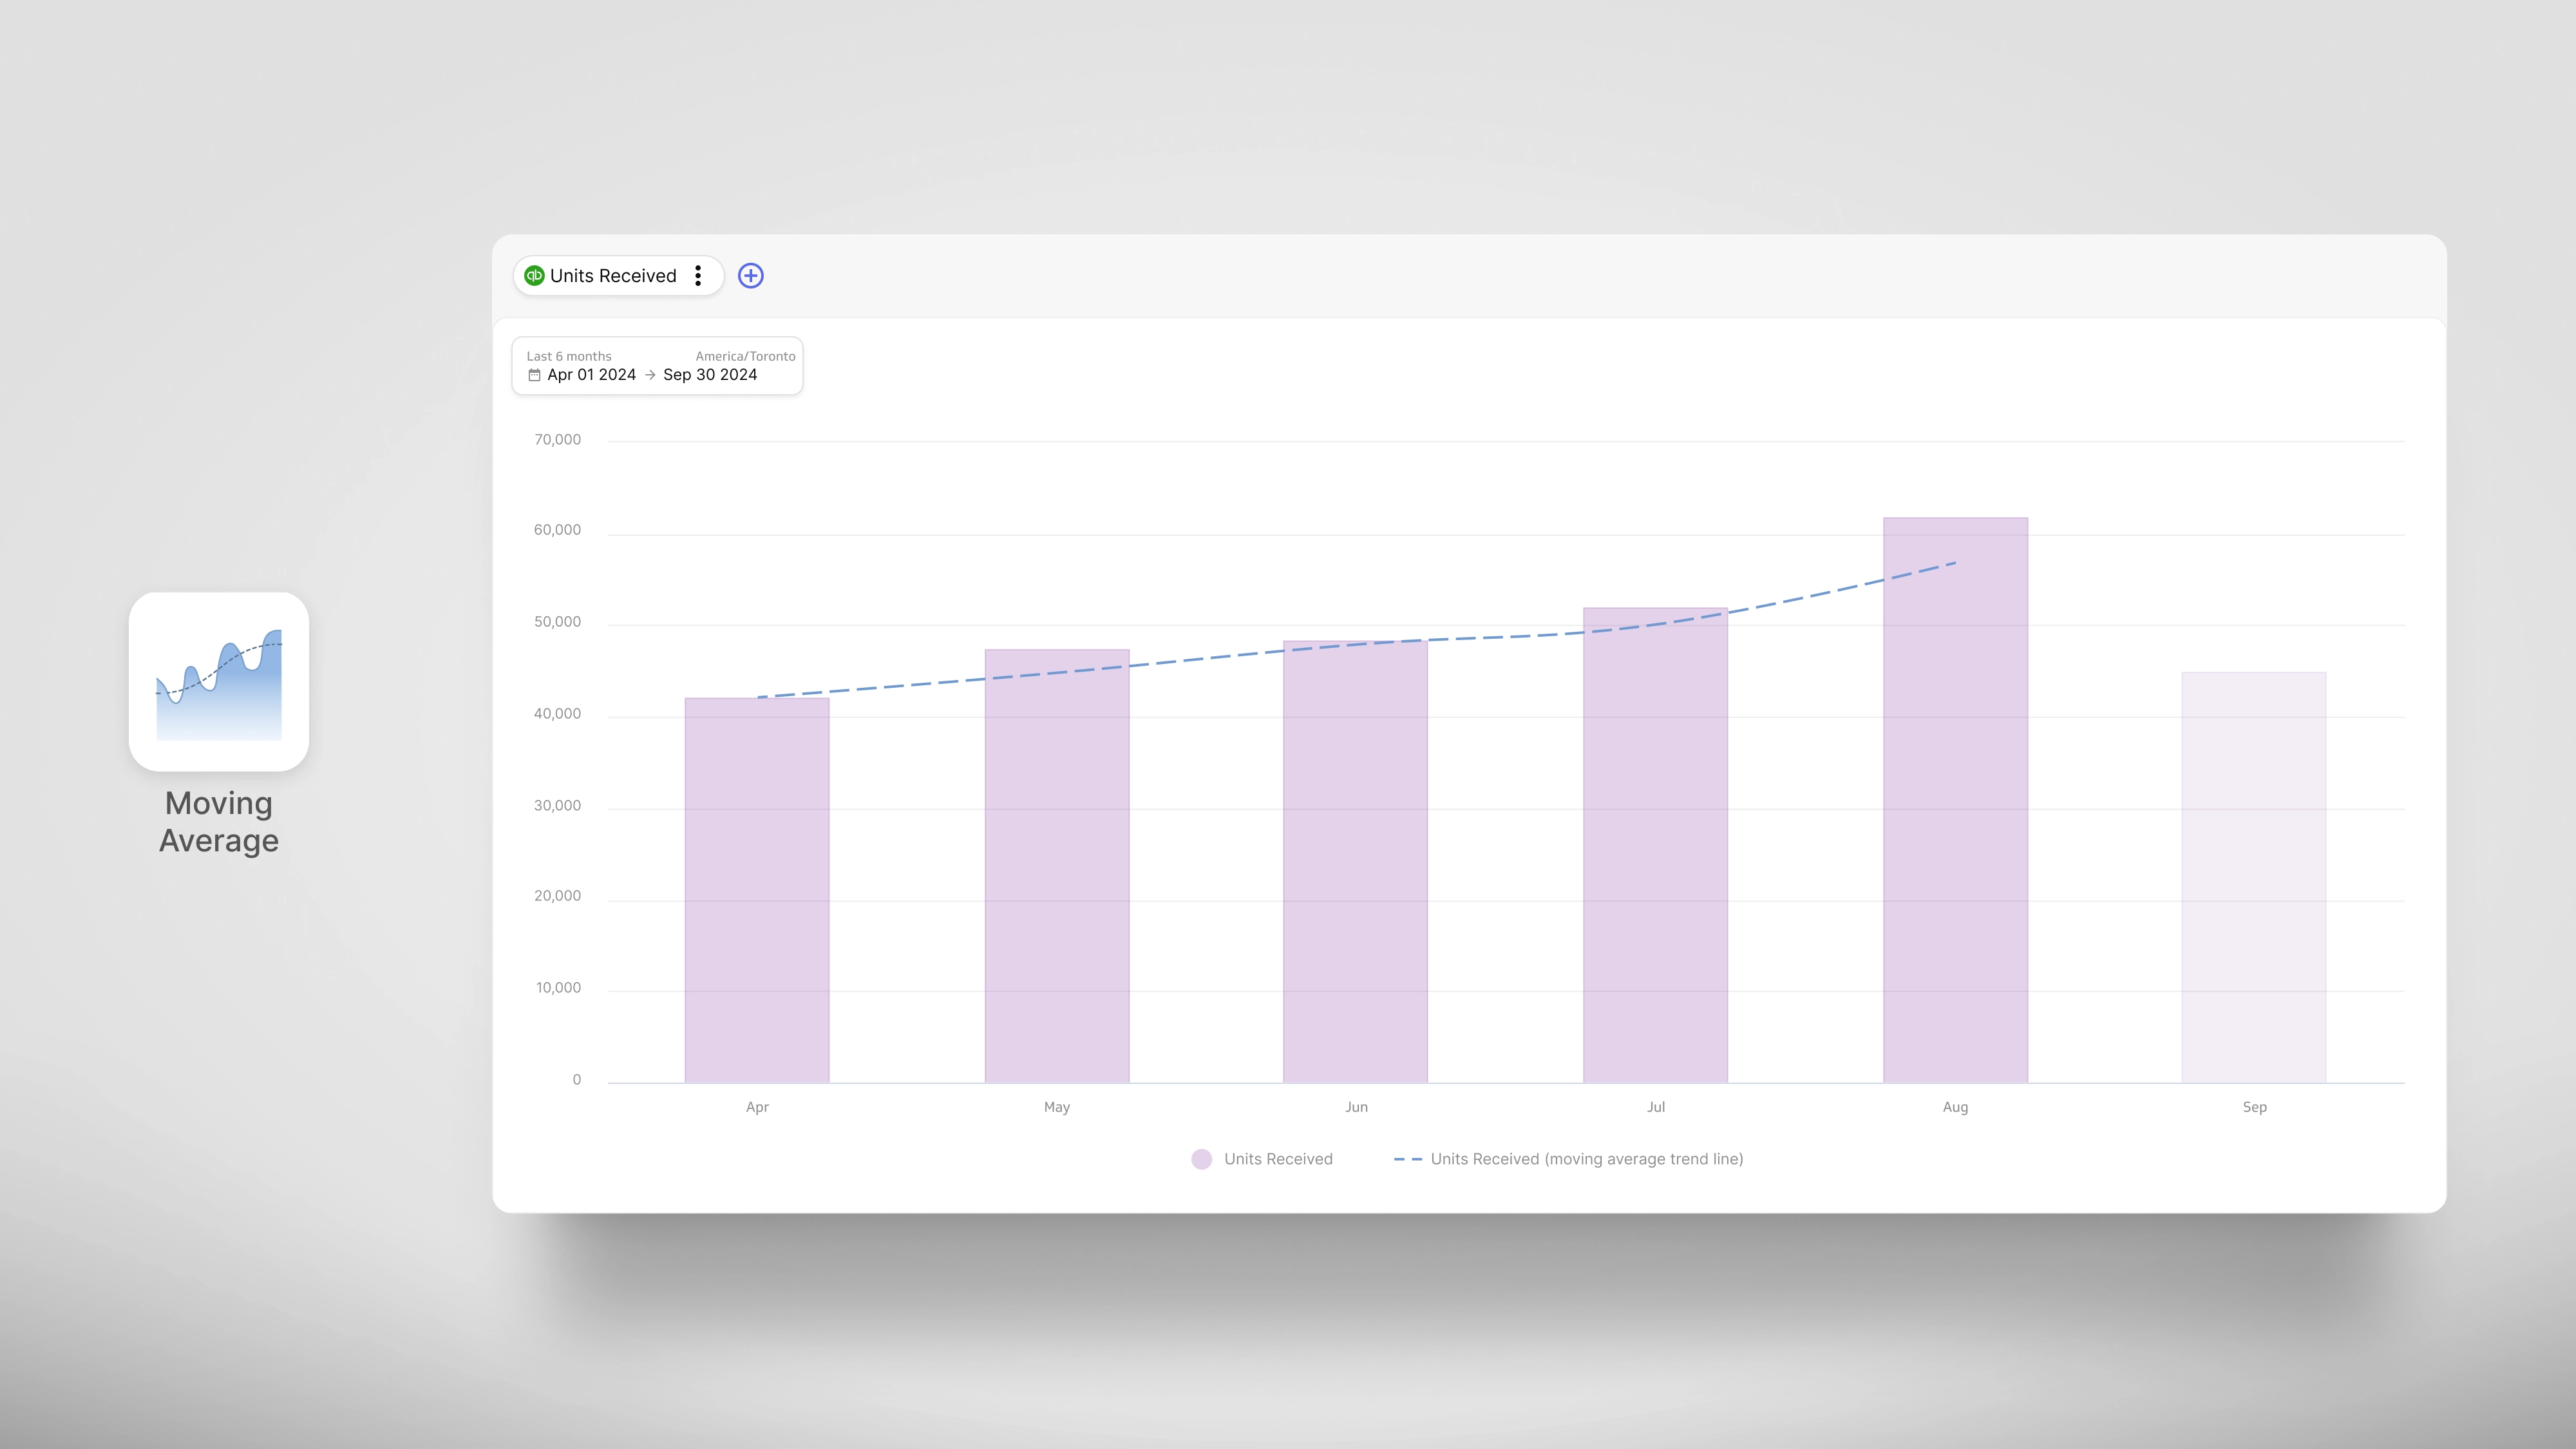
- Moving Average: Smooths out fluctuations to highlight the average trend line in your data.
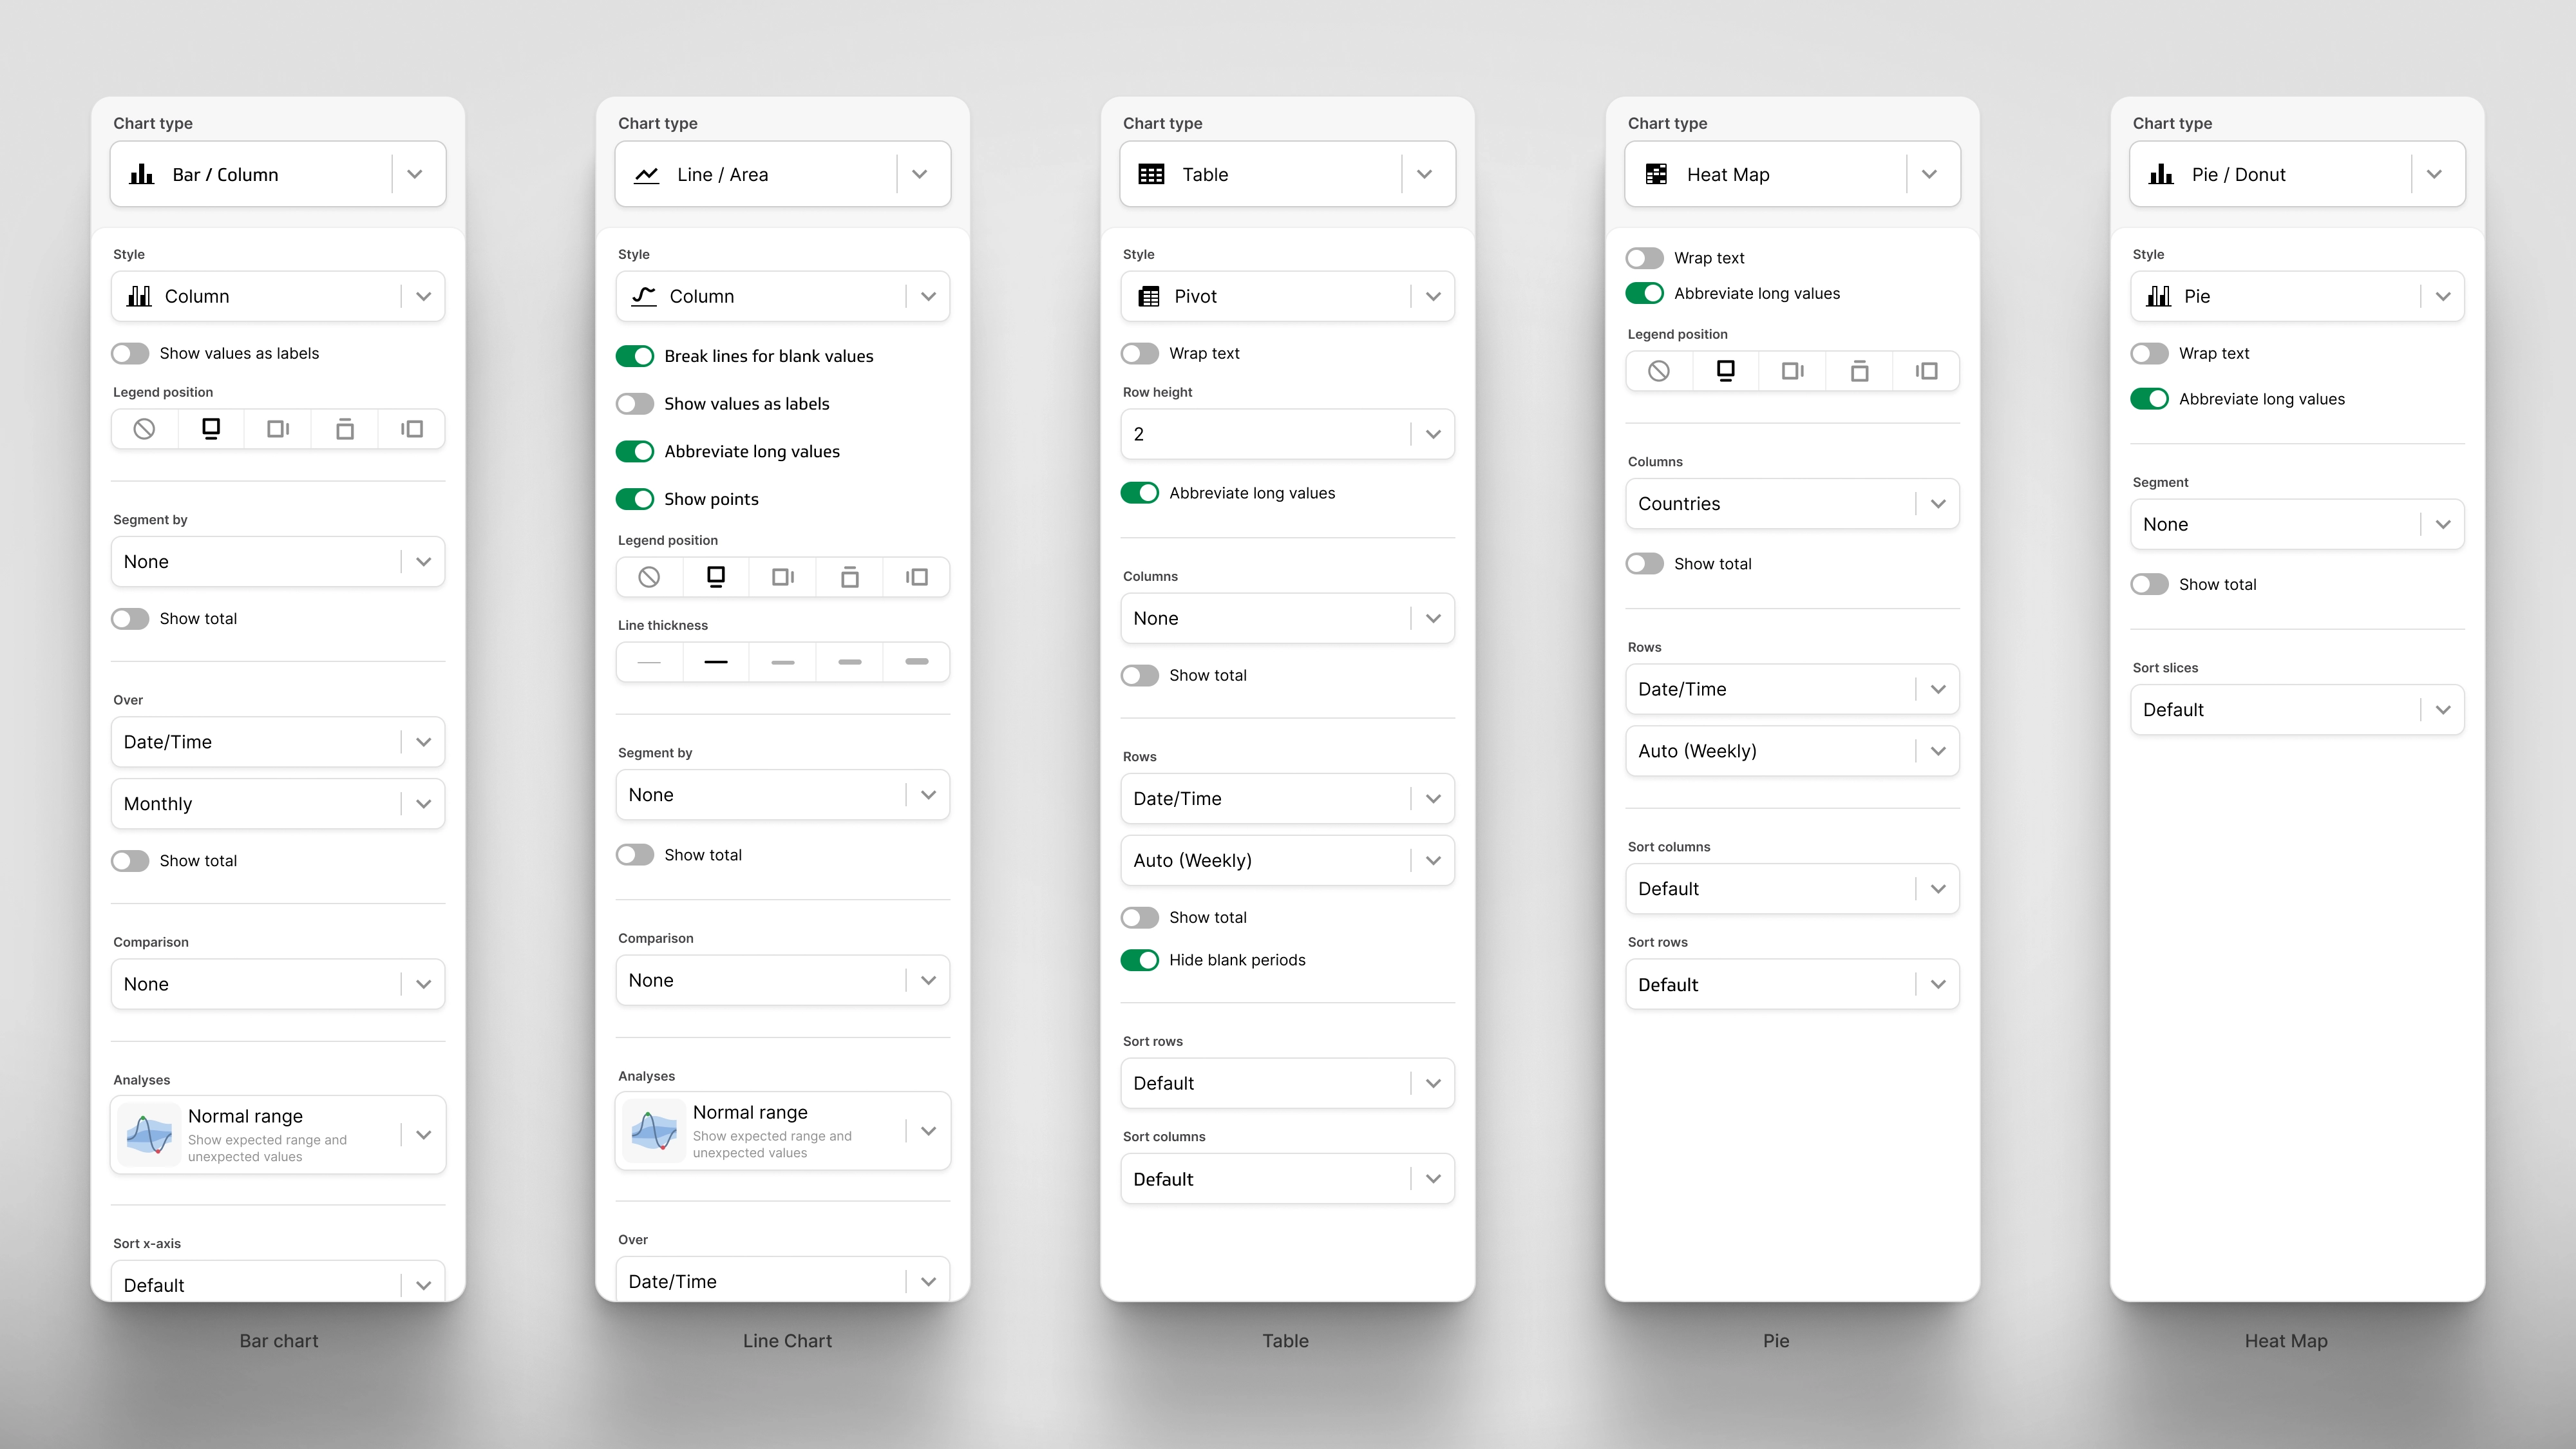
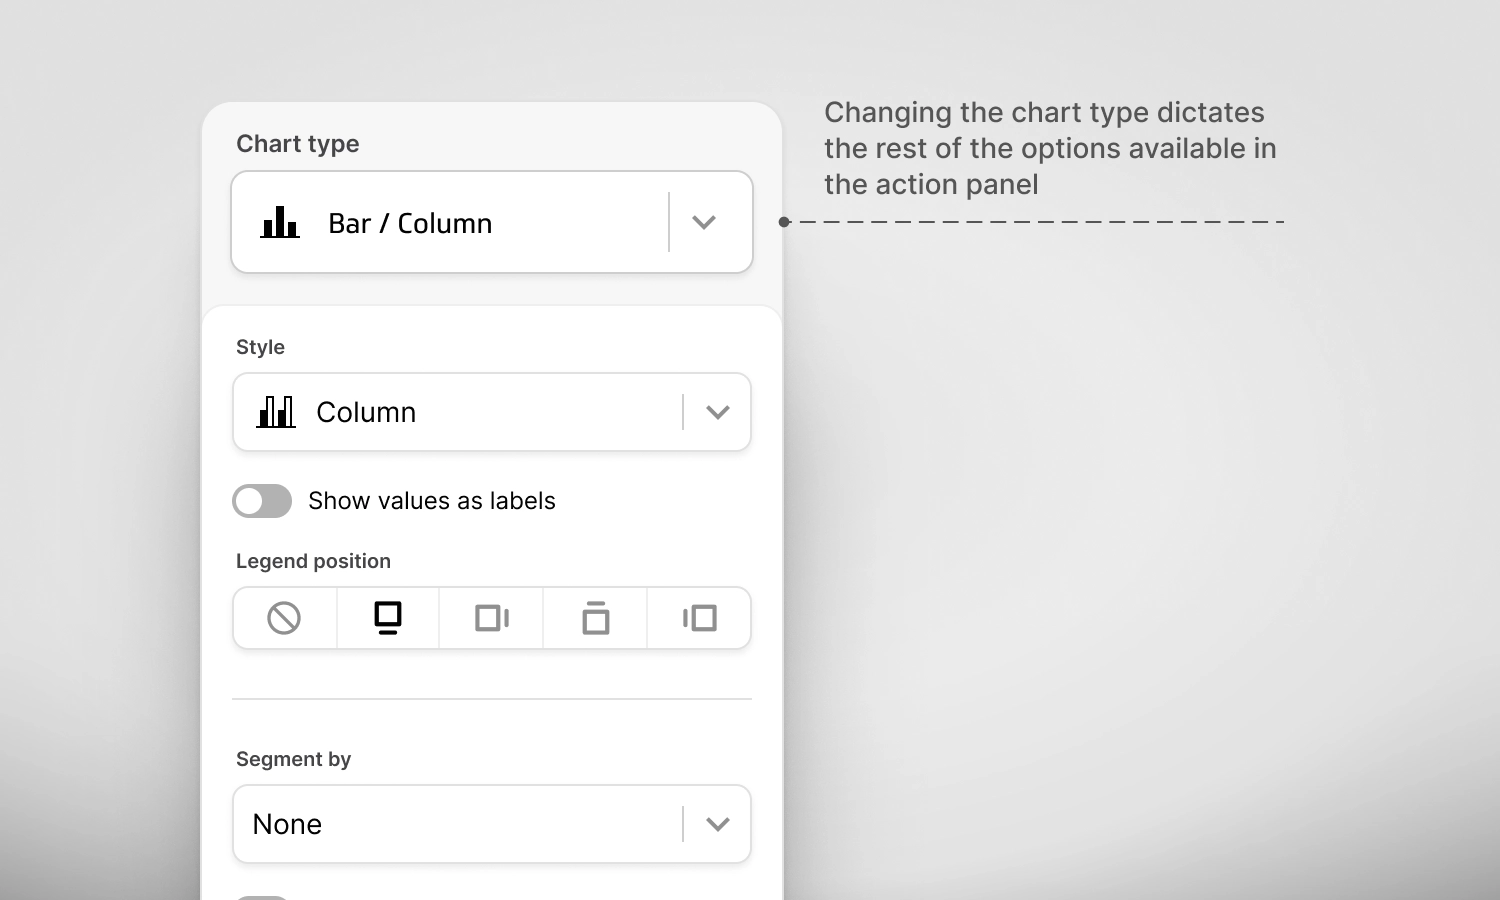
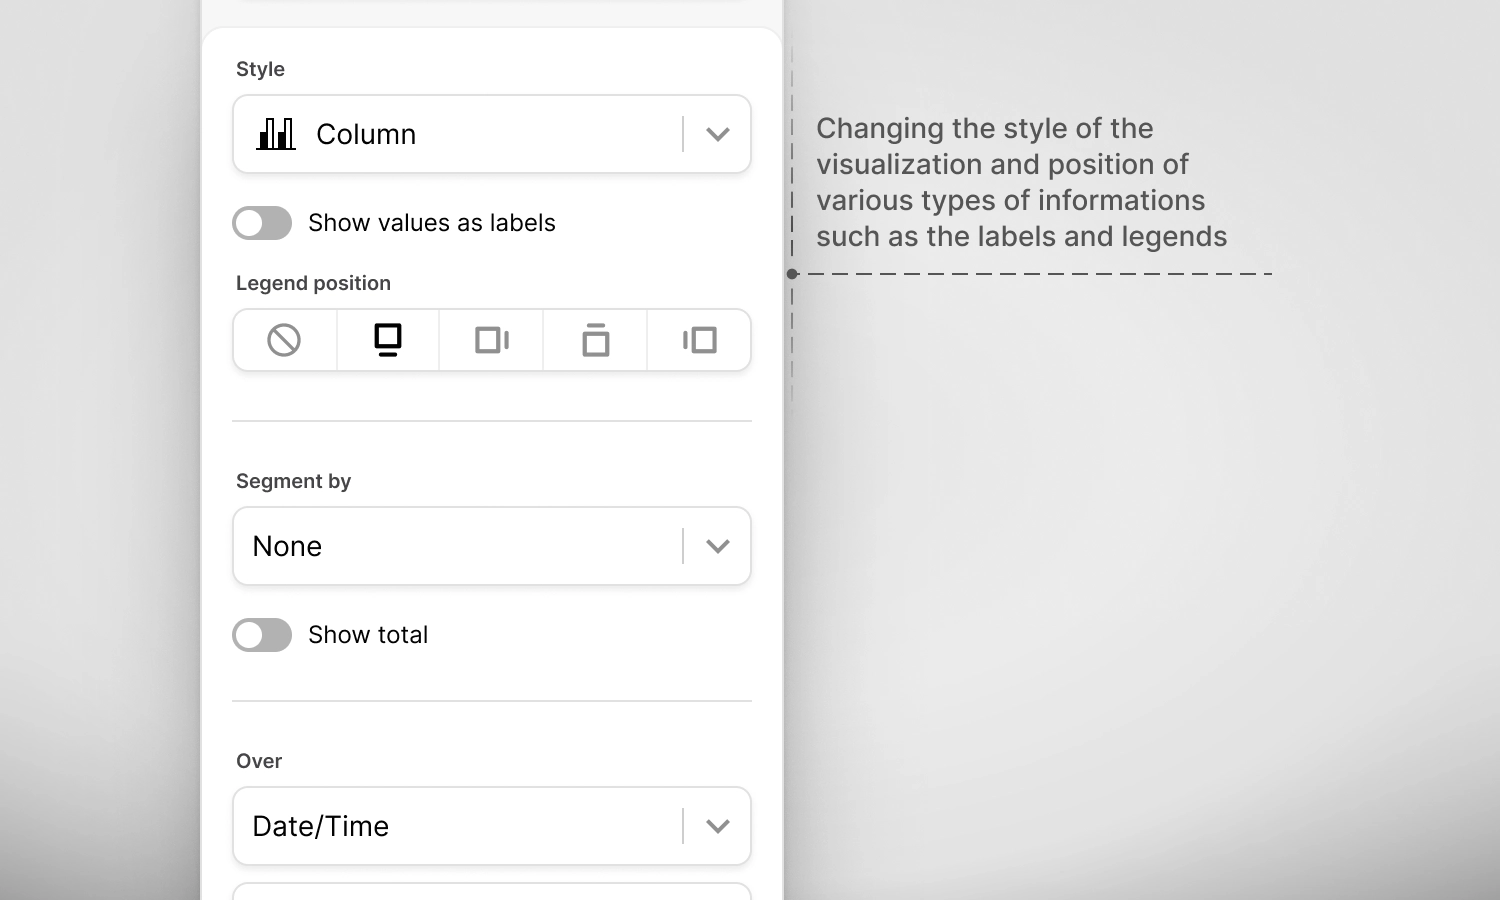
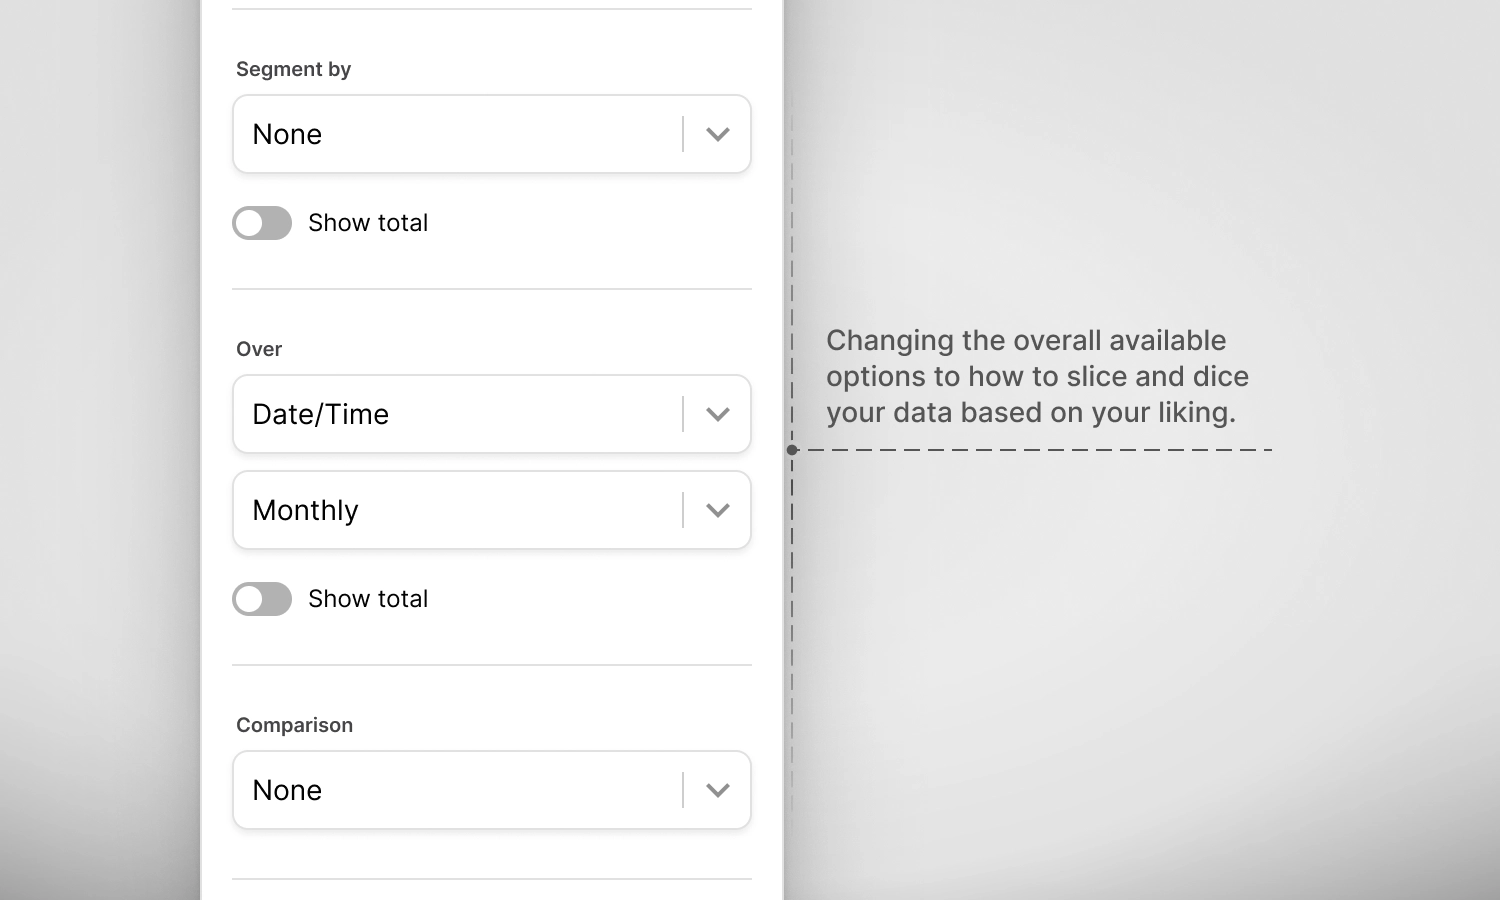
Exploration sidebar
A control center for fine-tuning your visualizations and uncovering the insights you need.
Key Requirements:
- Change visualization types dynamically.
- Menu settings adapt based on selected visualization.
- Choose segmentations and comparison types.
- Adjust sorting options with ease.
- Enable advanced analysis.
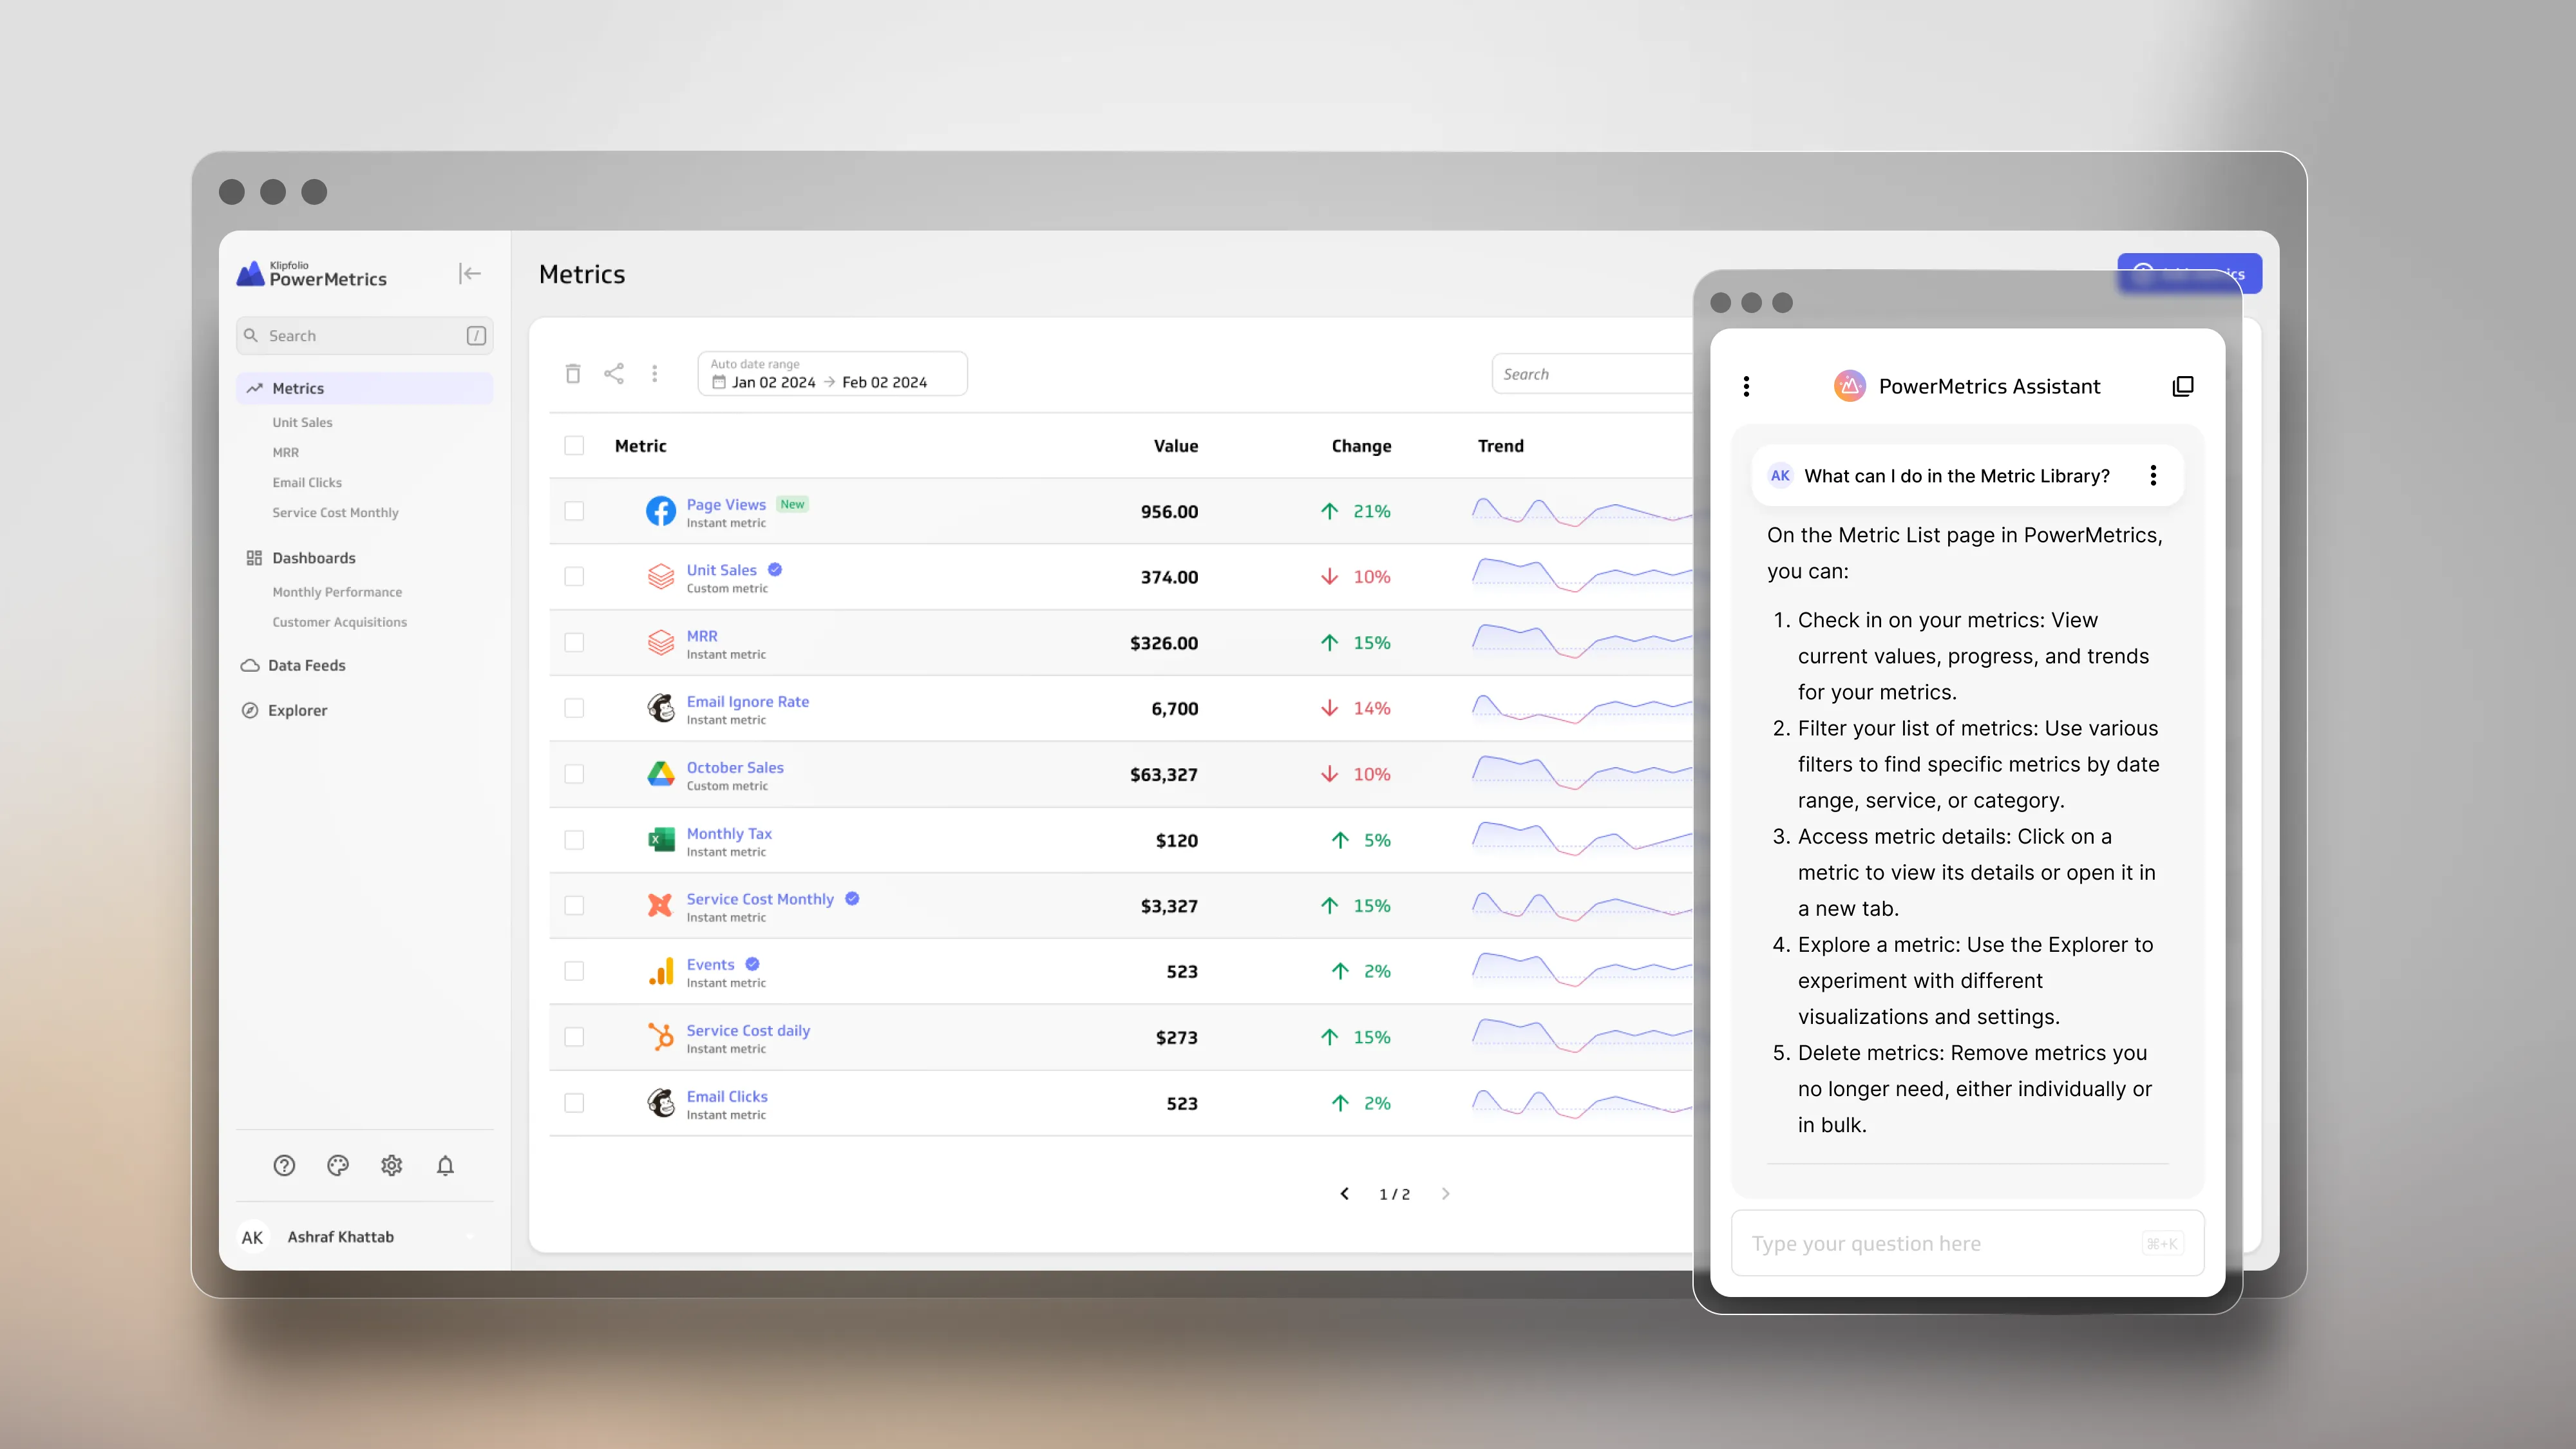
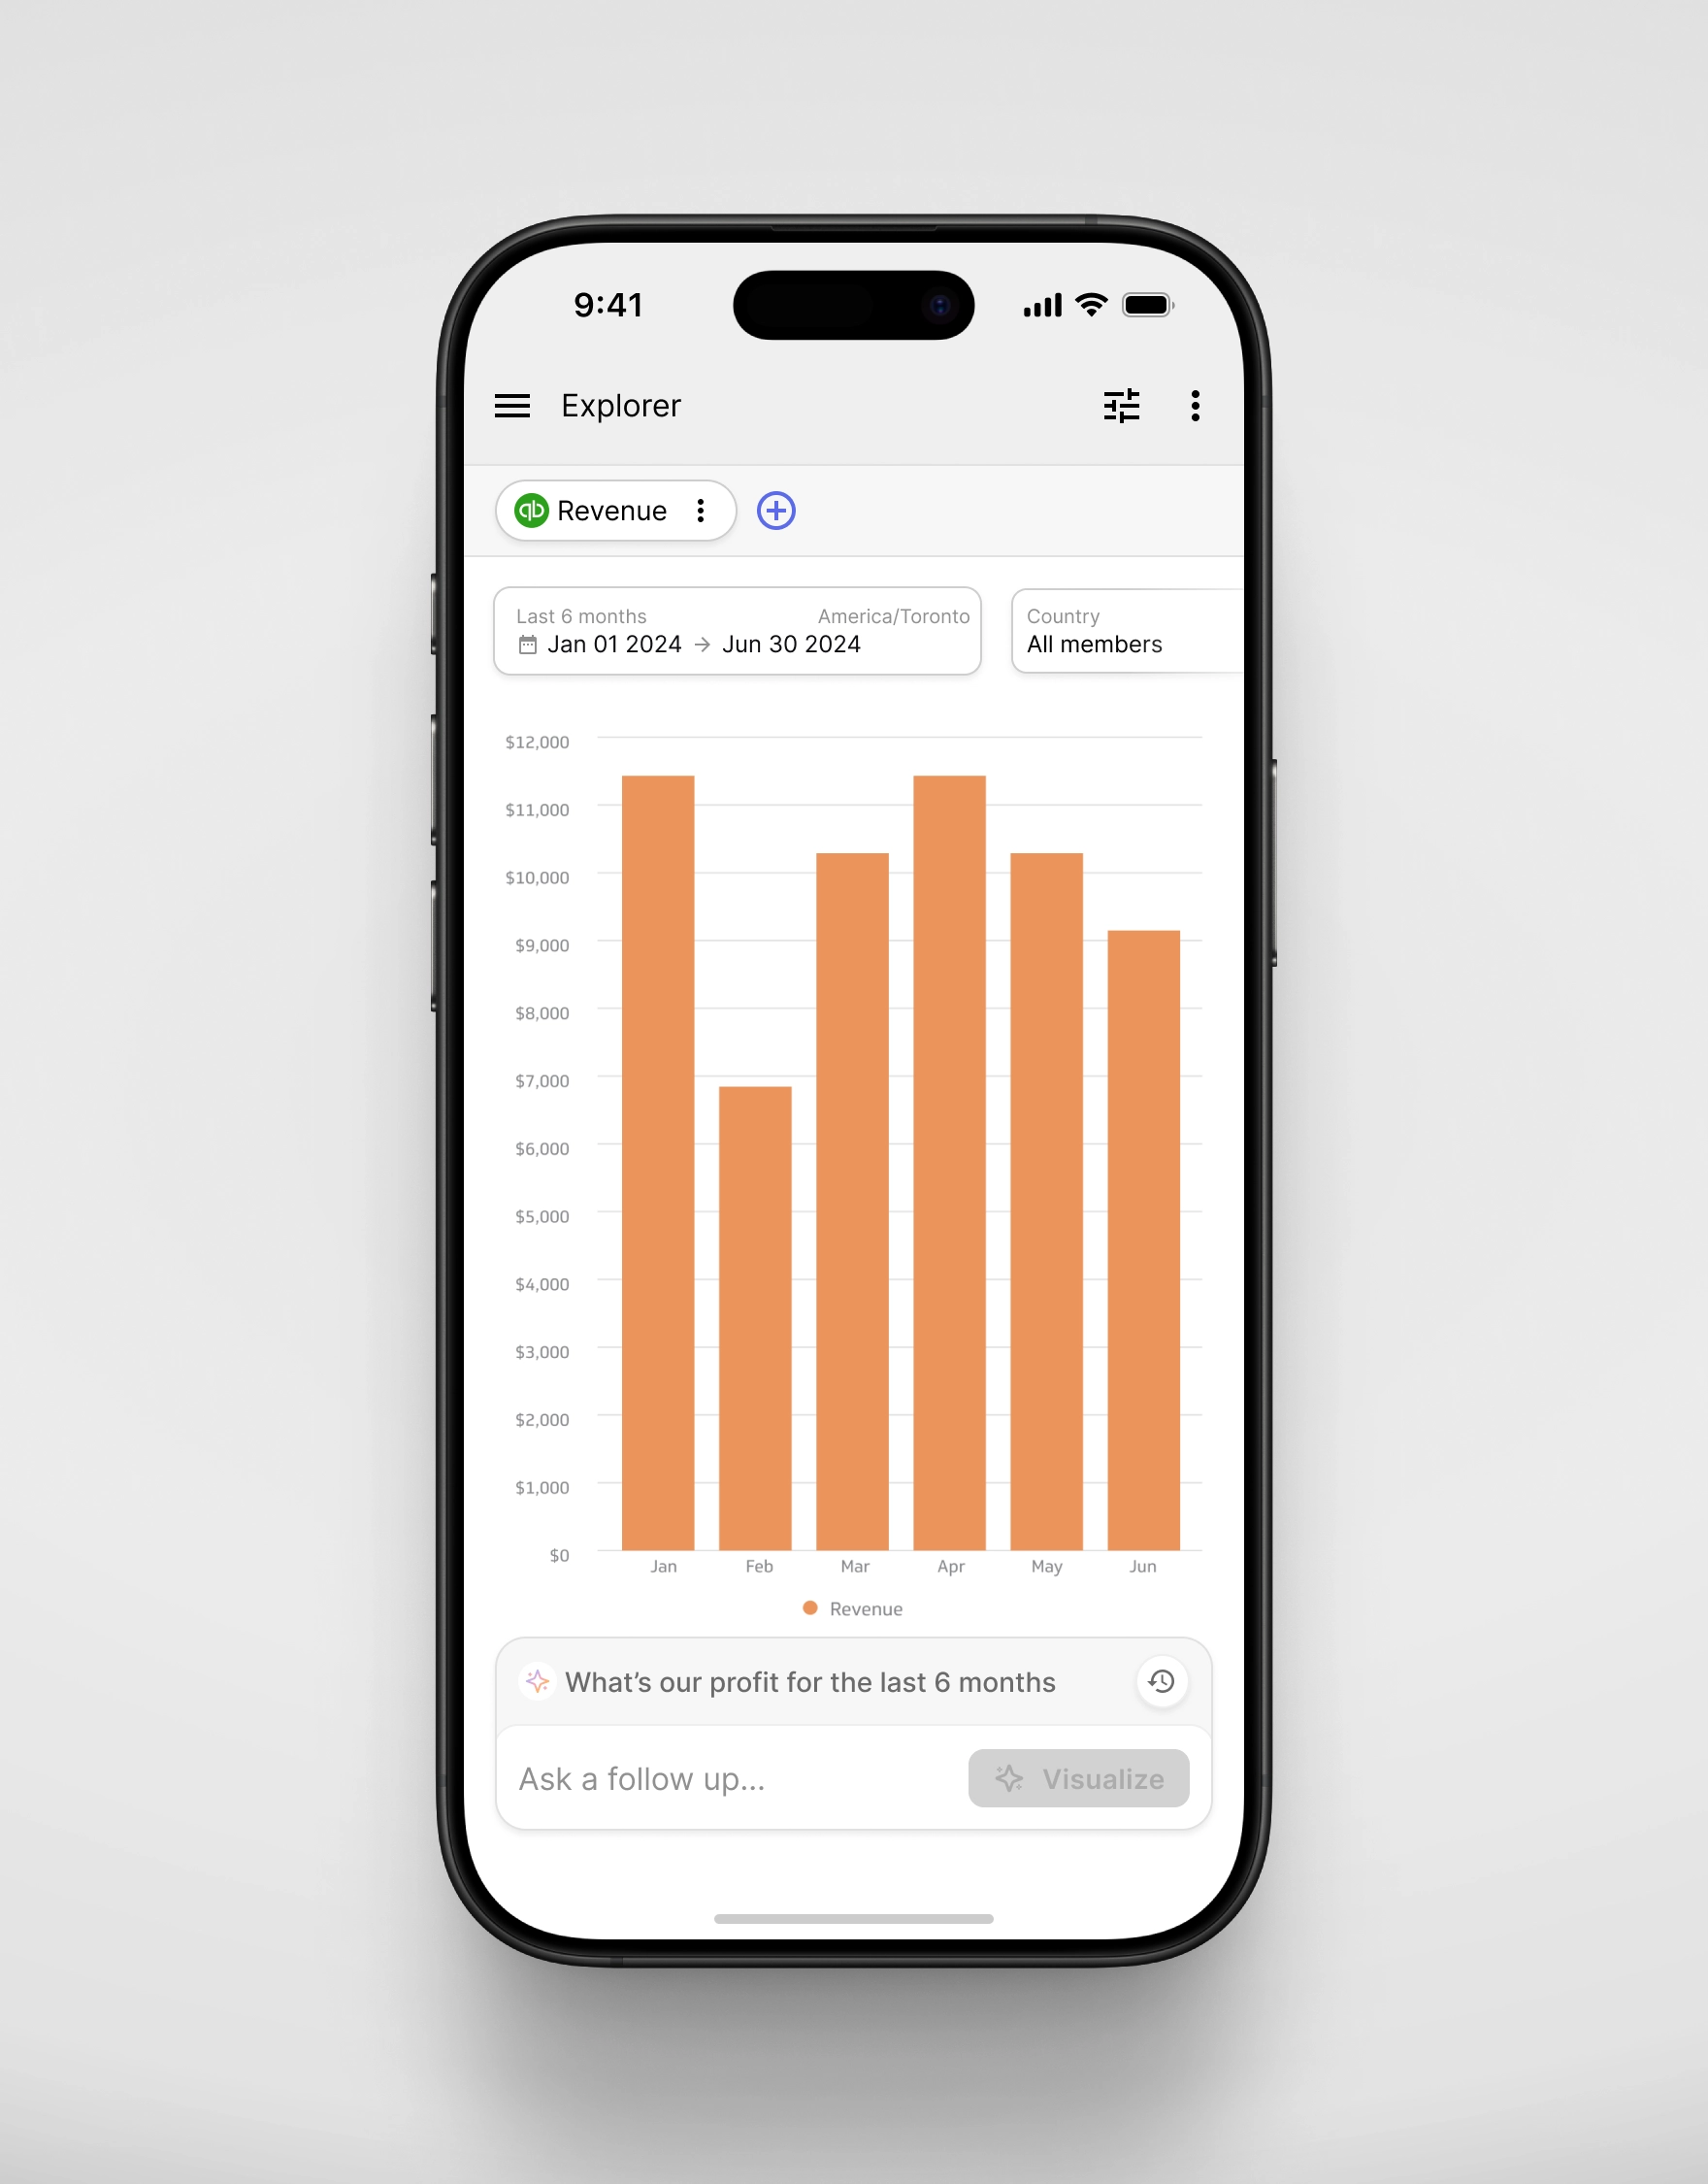
AI Assistant
Metrics are critical tools for driving outcomes by providing essential context. When paired with natural language processing, generative AI powered by metrics becomes a valuable asset for business users. Our focus is on integrating generative AI into metric interactions to enhance decision-making and provide actionable insights.
We’re starting with a targeted AI application that minimizes hallucinations, ensuring users can trust both the data and the insights generated. Building and maintaining this trust is essential as we roll out AI-driven solutions.
Key Requirements:
- Natural language queries for metrics, including filters, segments, advanced analysis, time ranges, and multiple metrics.
- Context retention, allowing the AI to remember previous questions or understand current metrics as references.
- History of previously asked questions for easy reference.
- Feedback mechanism (e.g., thumbs up/down) to improve accuracy and user satisfaction.
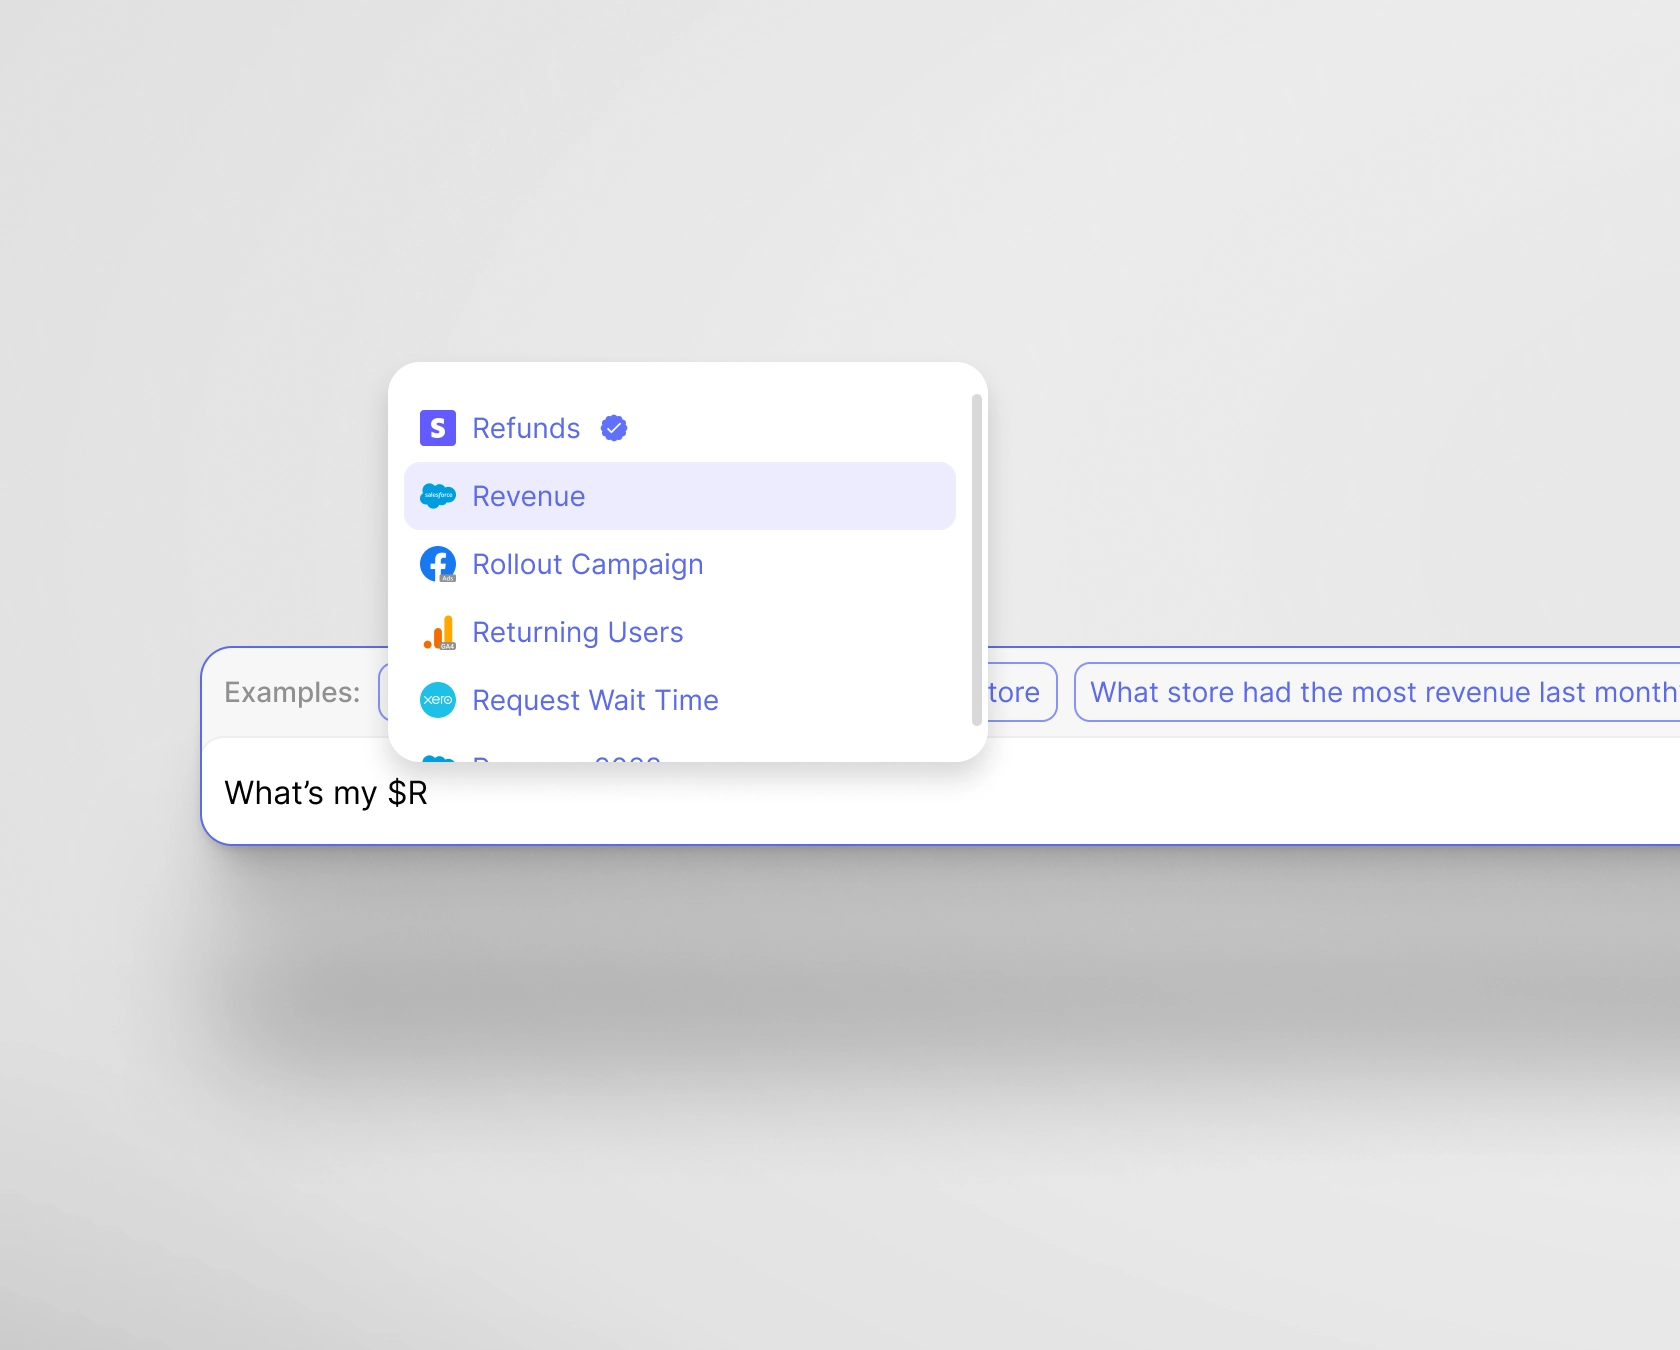
- Auto-completion for metric names to enhance precision.
- Minimized hallucinations through referencing user intent examples.
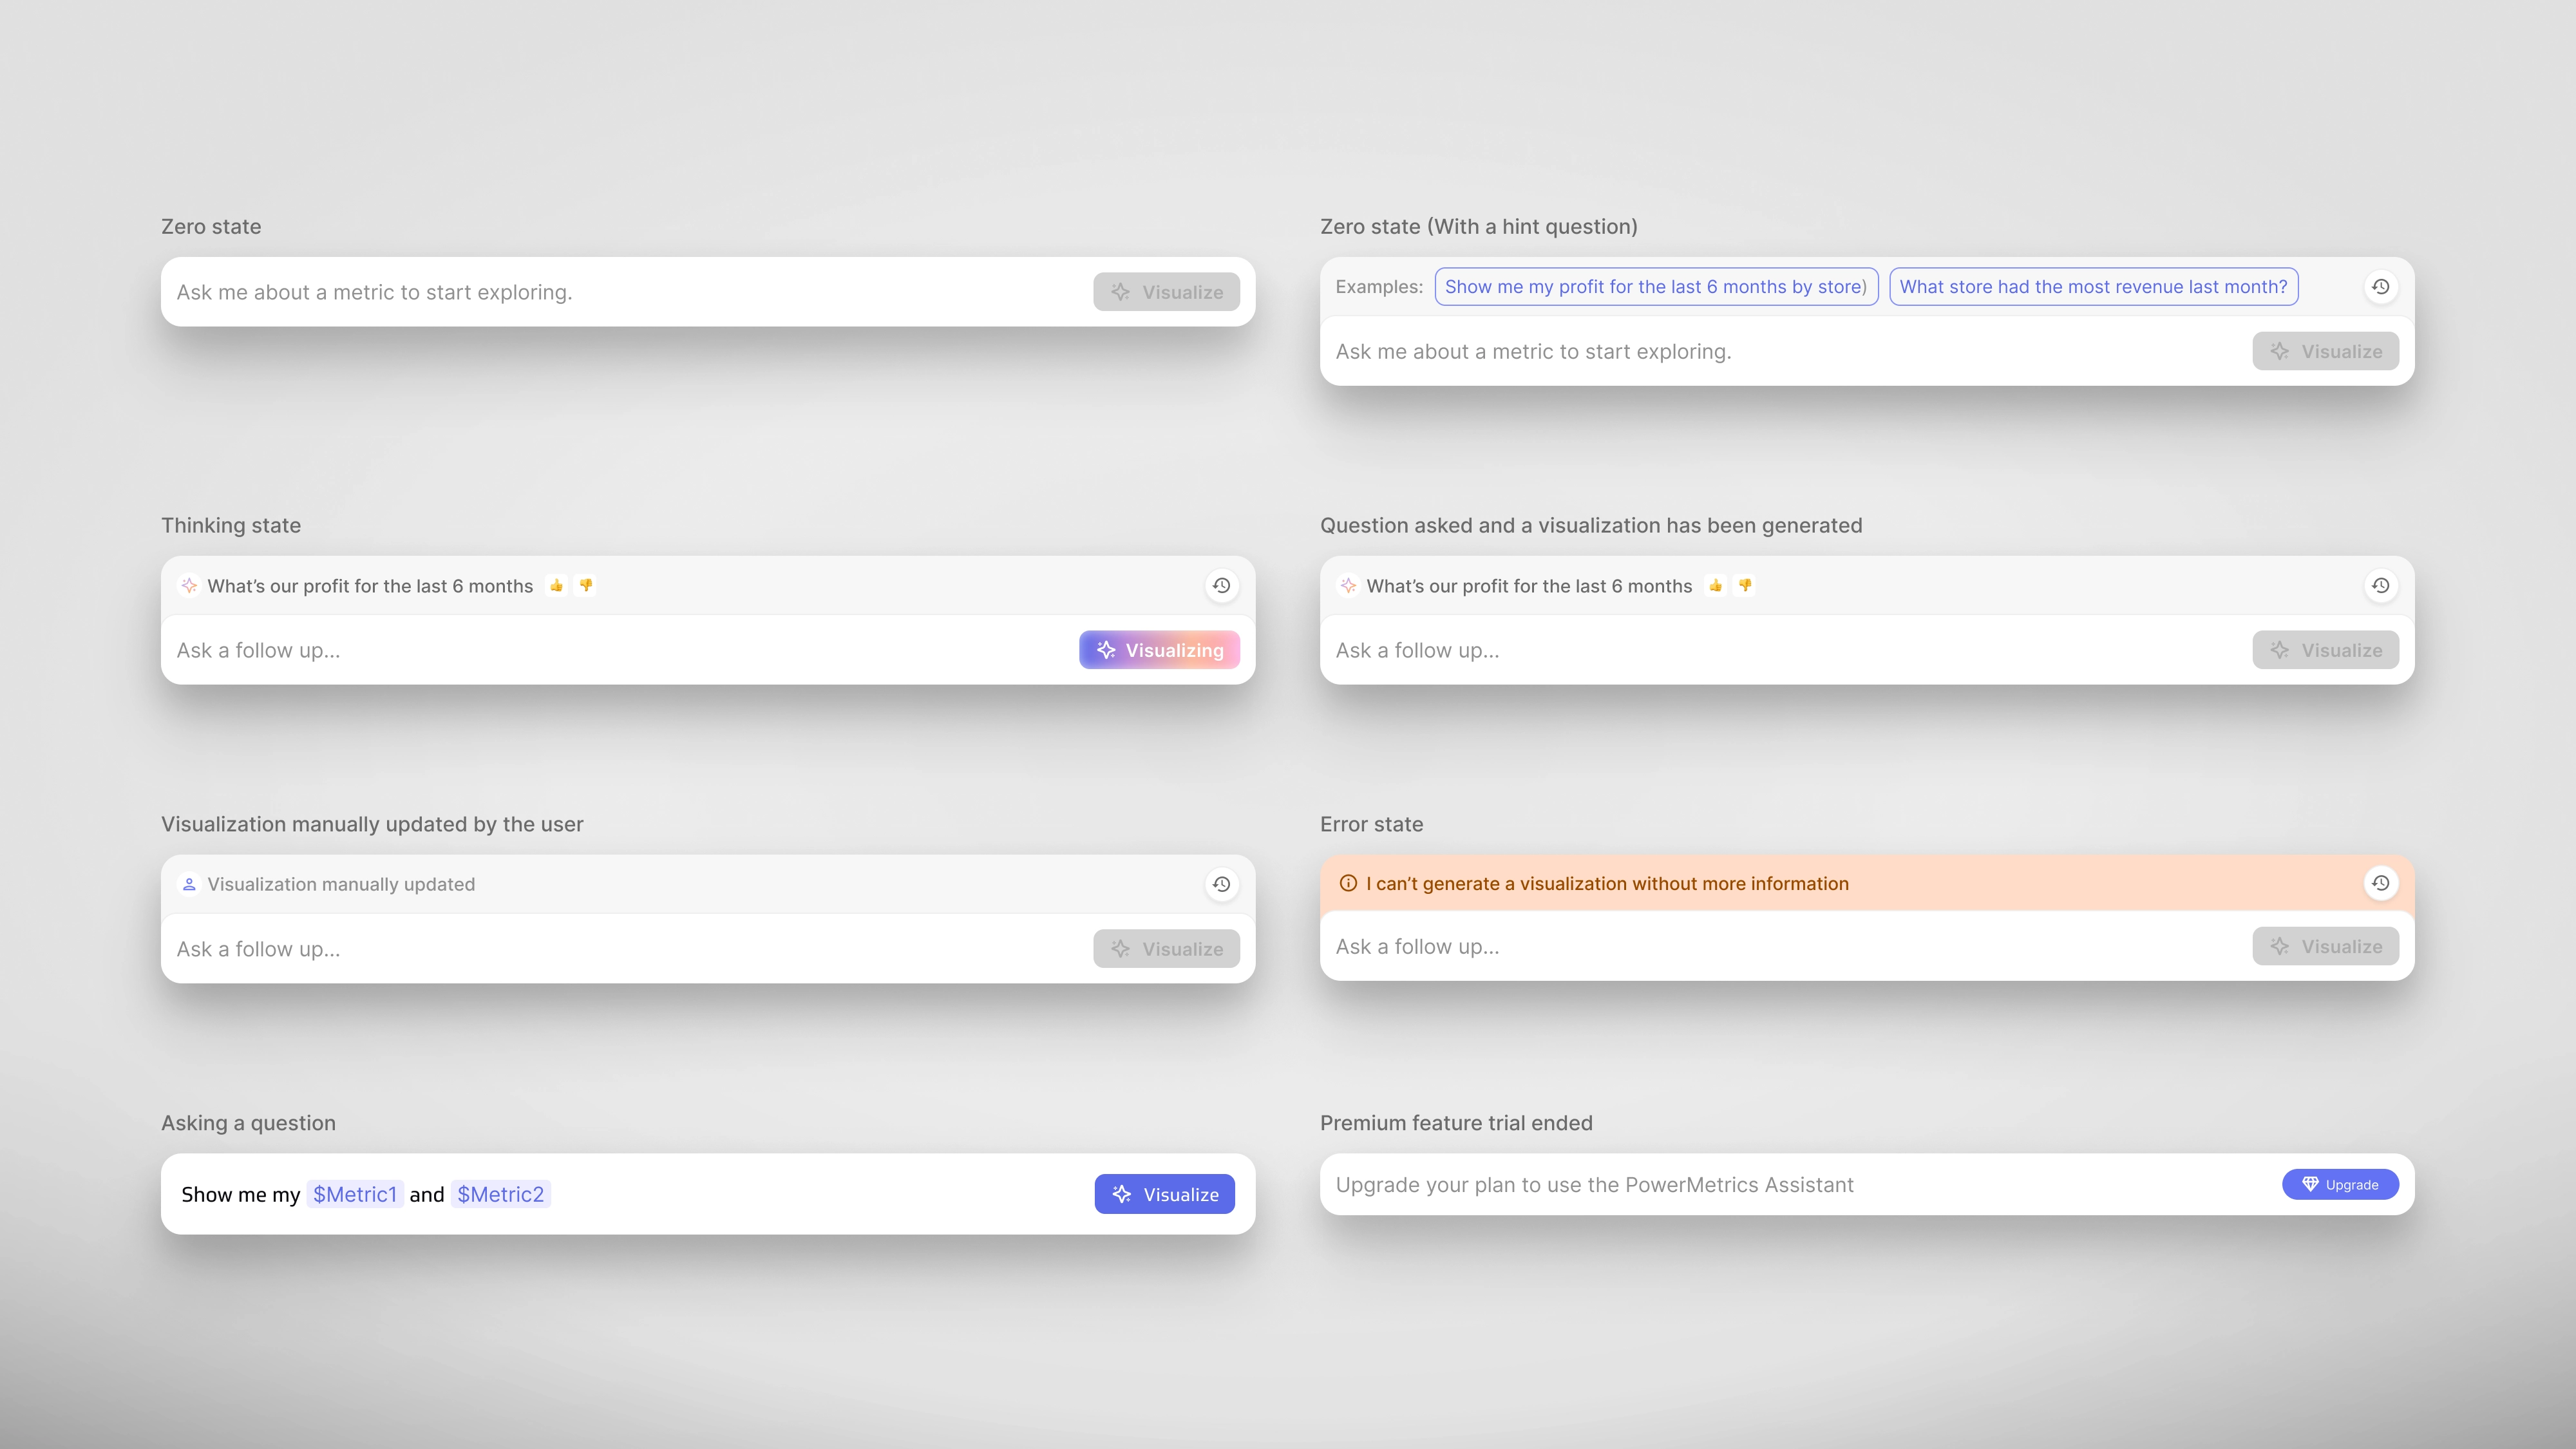
History checkpoints
The AI retains context from previous requests, influencing future responses. We also provide users with checkpoints, allowing them to easily return to previous states as needed.

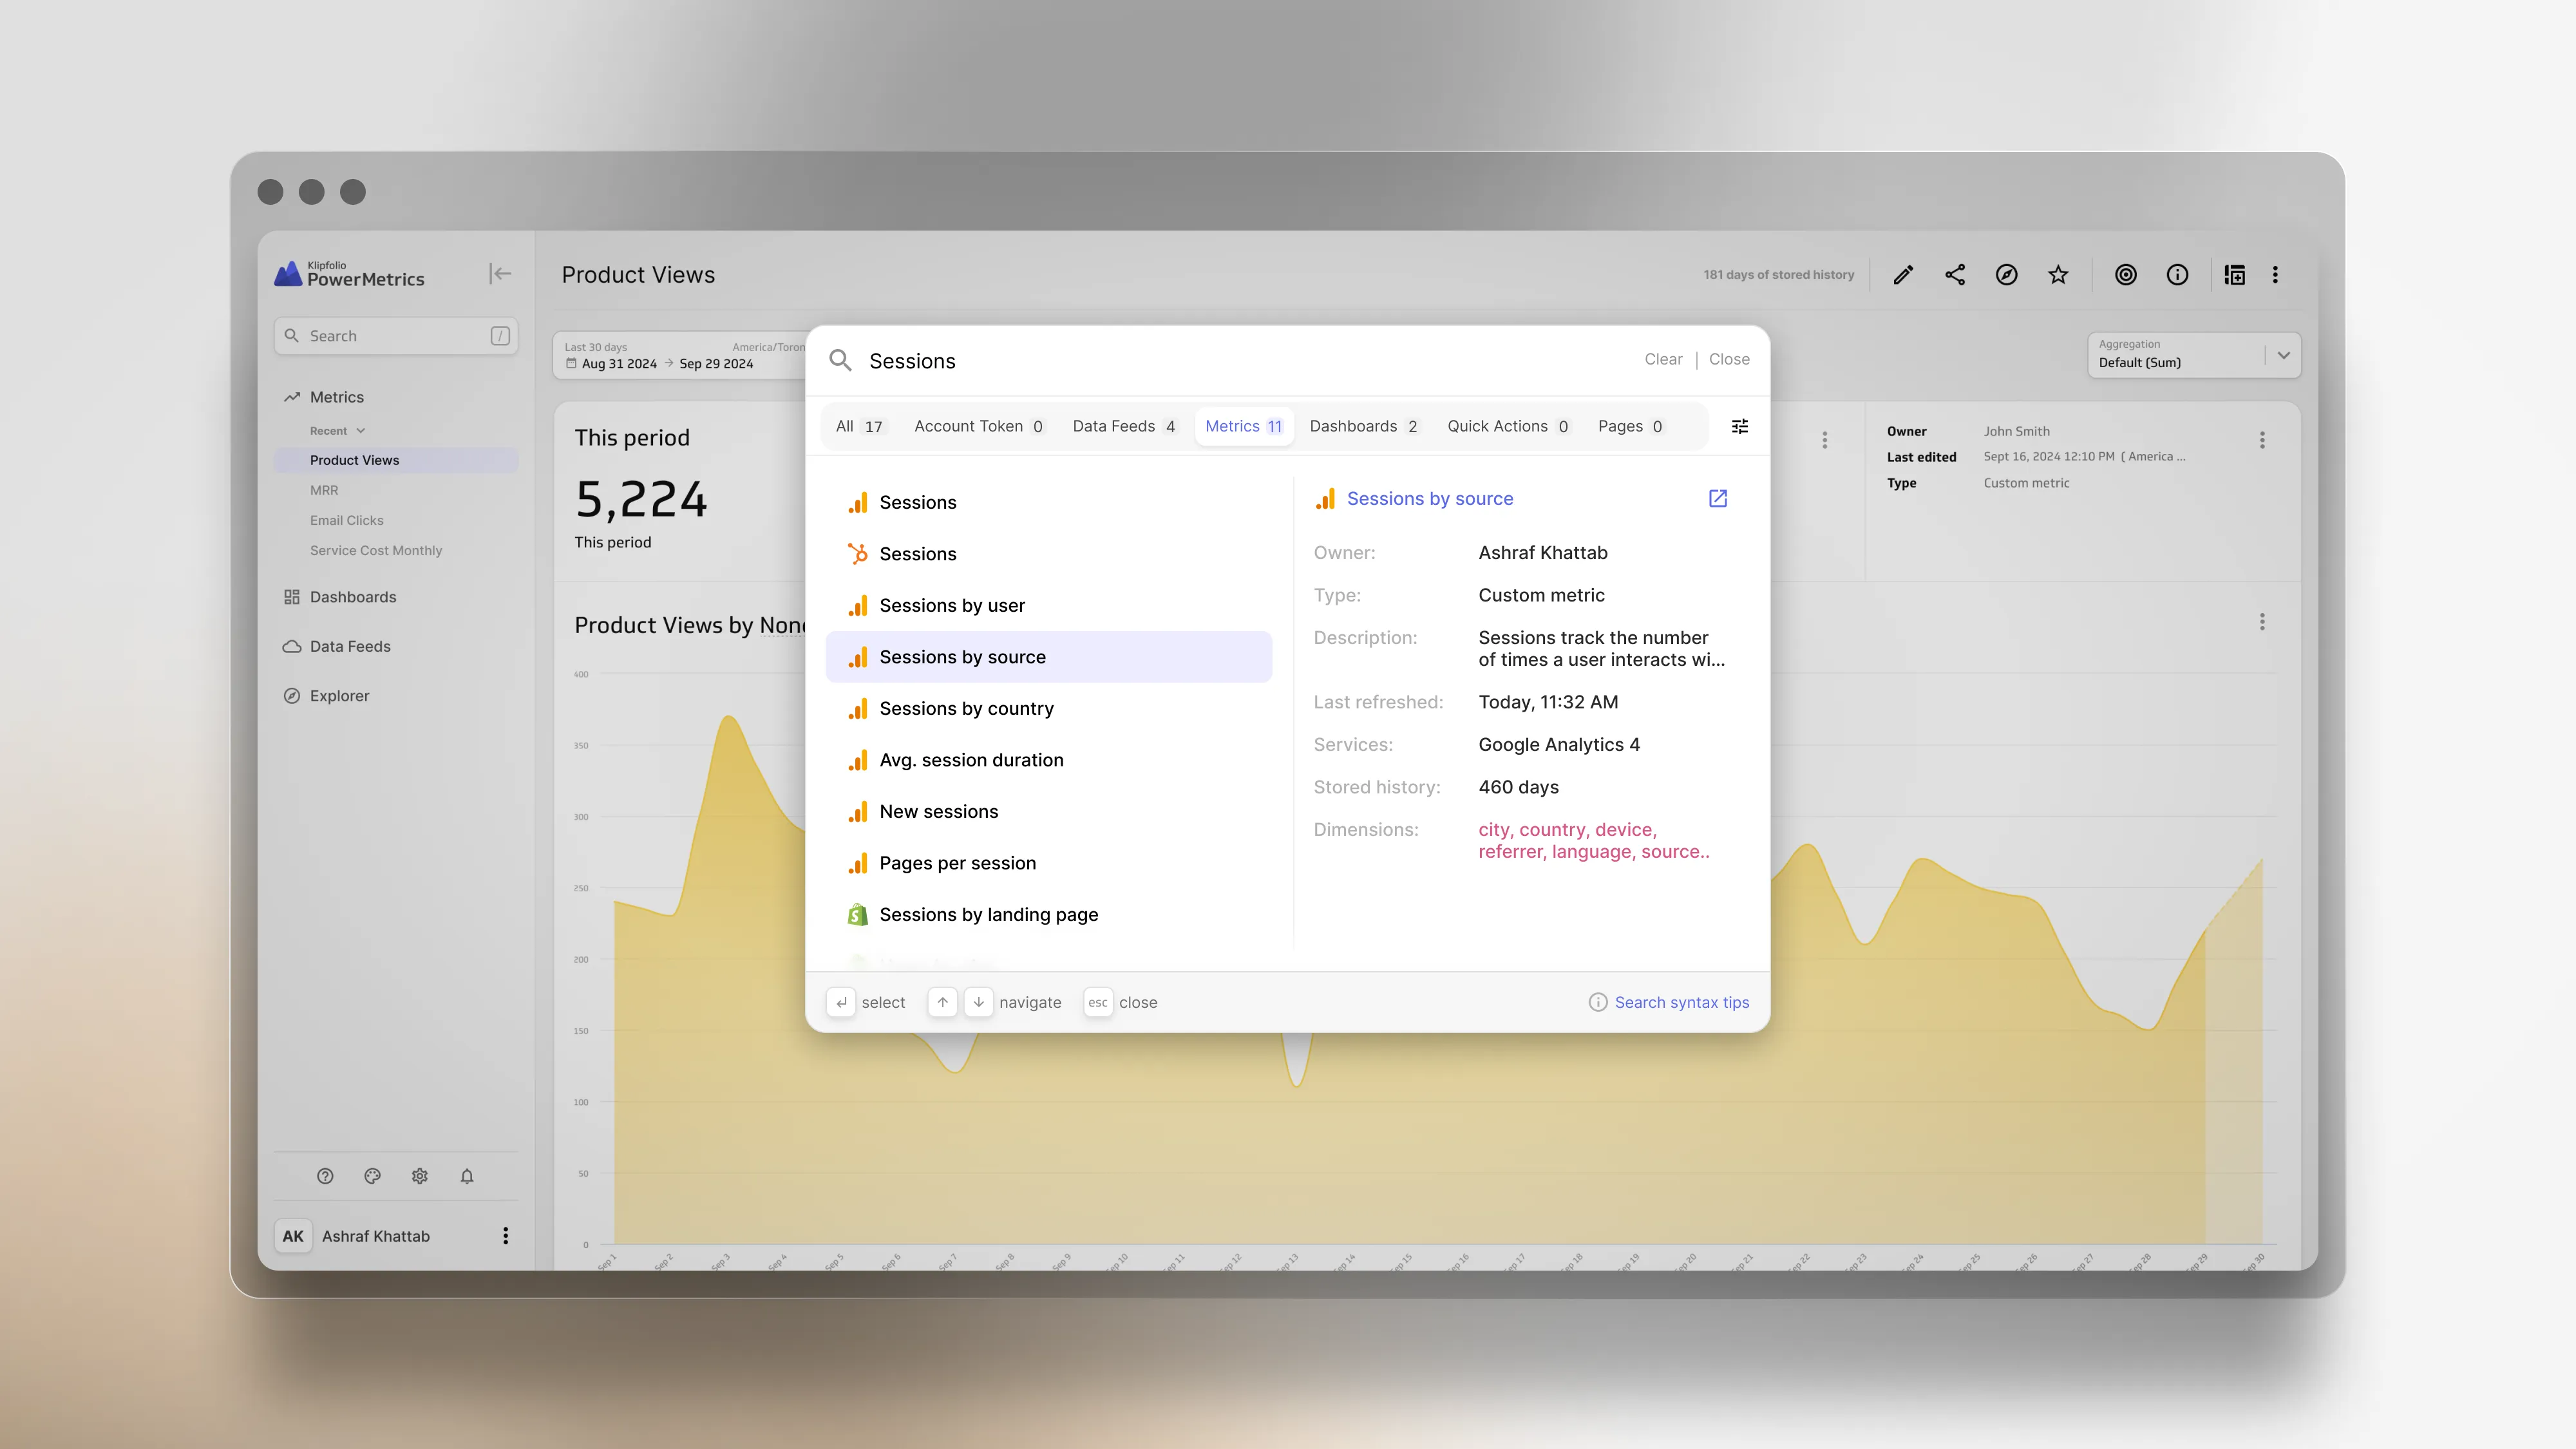
Autocomplete
Giving users the ability to autocomplete the metric name helps a lot with enhancing precision.
Intent
To make the AI work, we need to assign a list of intent and examples to guide the AI
Intention
Example
Comparison by Time Period
What are the website page views this month vs. last month
Comparison, Segment vs. Segment
Compare users from organic search vs. direct search
Comparison, Metric vs. Metric
Compare Ad Spend vs Advertising Costs
Forecast
What do the website pageviews look like in the next 6 months?
Trend
Are pageviews up or down the last 30 days?
Value
What day of the week does the website get the most visits?
Math
What is the website's total users count for last year?
Breakdown
Show website users by organic search
Ranking
Show me the 10 most viewed web pages last month
Metric by chart type
Show it in a table
Out of scope, gibberish, impossible
How old is Elon Musk?, Show me revenue by revenue, "Jiwnnfnreube"
Reset
Let's start over
Overview
How are sign ups doing?
Correlation/Relation
What caused our sign ups to spike this week?
Expected range
How is my revenue expected to behave? Is my profit behaving normally?
Composite intention
Compare my cost and revenue, broken down by X
Clarification
AI Response: Which metric specifically did you want to explore
Out of scope
Users requests are limitless, but our system has limiations. So we needed to account for intents that are technically out of scope of this current version of generative AI capabilities.
Intention
Example
Asset search
Show me the "marketing dashboard"
Catalog-level Insight
Are there any important trends from over the weekend?
General search
How many page views does Forbes.com get everyday?
Key business and product outcomes
- 30% increase in customers inviting view-only users, enabling more flexible metric exploration for their end/business users.
- 12% growth in product sign-ups following the launch of the generative AI feature, driven by heightened interest.
- Increased customer requests for additional features to expand Explorer capabilities.